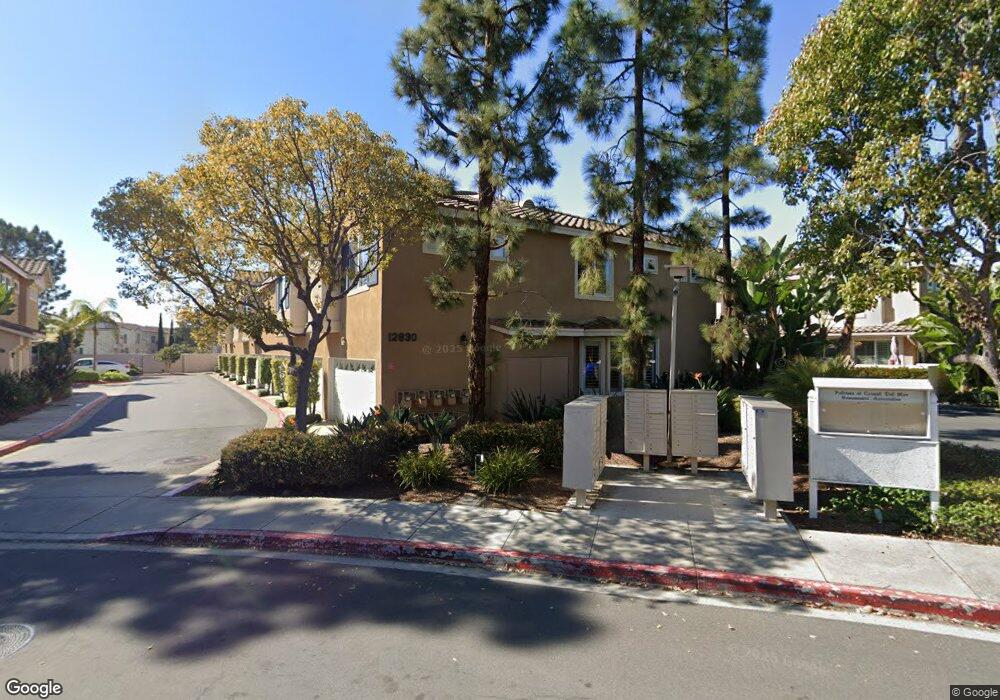
12830 Via Nieve Unit 84 San Diego, CA 92130
Carmel Valley NeighborhoodEstimated Value: $868,760 - $983,000
2
Beds
3
Baths
1,146
Sq Ft
$823/Sq Ft
Est. Value
About This Home
This home is located at 12830 Via Nieve Unit 84, San Diego, CA 92130 and is currently estimated at $943,190, approximately $823 per square foot. 12830 Via Nieve Unit 84 is a home located in San Diego County with nearby schools including Carmel Creek Elementary School, Solana Pacific Elementary School, and Carmel Valley Middle School.
Ownership History
Date
Name
Owned For
Owner Type
Purchase Details
Closed on
Mar 4, 2025
Sold by
Brami Carol S
Bought by
Carol S Brami Trust and Brami
Current Estimated Value
Purchase Details
Closed on
Jun 19, 2003
Sold by
Ziegler Carol Sue
Bought by
Brami Carol
Home Financials for this Owner
Home Financials are based on the most recent Mortgage that was taken out on this home.
Original Mortgage
$95,000
Interest Rate
4.64%
Mortgage Type
Purchase Money Mortgage
Purchase Details
Closed on
Jan 17, 2001
Sold by
Ziegler Carol S
Bought by
Ziegler Carol Sue
Purchase Details
Closed on
Mar 12, 1998
Sold by
Brookfield Palermo Inc
Bought by
Ziegler Carol Sue
Home Financials for this Owner
Home Financials are based on the most recent Mortgage that was taken out on this home.
Original Mortgage
$98,900
Interest Rate
6.88%
Mortgage Type
Purchase Money Mortgage
Create a Home Valuation Report for This Property
The Home Valuation Report is an in-depth analysis detailing your home's value as well as a comparison with similar homes in the area
Home Values in the Area
Average Home Value in this Area
Purchase History
| Date | Buyer | Sale Price | Title Company |
|---|---|---|---|
| Carol S Brami Trust | -- | None Listed On Document | |
| Brami Carol | -- | Fidelity National Title Co | |
| Brami Carol | -- | Fidelity National Title Co | |
| Ziegler Carol Sue | -- | -- | |
| Ziegler Carol Sue | $159,000 | Chicago Title Company |
Source: Public Records
Mortgage History
| Date | Status | Borrower | Loan Amount |
|---|---|---|---|
| Previous Owner | Brami Carol | $95,000 | |
| Previous Owner | Ziegler Carol Sue | $98,900 |
Source: Public Records
Tax History Compared to Growth
Tax History
| Year | Tax Paid | Tax Assessment Tax Assessment Total Assessment is a certain percentage of the fair market value that is determined by local assessors to be the total taxable value of land and additions on the property. | Land | Improvement |
|---|---|---|---|---|
| 2025 | $3,374 | $249,081 | $101,887 | $147,194 |
| 2024 | $3,374 | $244,198 | $99,890 | $144,308 |
| 2023 | $3,380 | $239,411 | $97,932 | $141,479 |
| 2022 | $3,311 | $234,717 | $96,012 | $138,705 |
| 2021 | $3,267 | $230,116 | $94,130 | $135,986 |
| 2020 | $3,245 | $227,757 | $93,165 | $134,592 |
| 2019 | $3,198 | $223,292 | $91,339 | $131,953 |
| 2018 | $3,152 | $218,915 | $89,549 | $129,366 |
| 2017 | $3,111 | $214,624 | $87,794 | $126,830 |
| 2016 | $2,973 | $210,417 | $86,073 | $124,344 |
| 2015 | $2,940 | $207,258 | $84,781 | $122,477 |
| 2014 | $2,897 | $203,199 | $83,121 | $120,078 |
Source: Public Records
Map
Nearby Homes
- 12620 Carmel Country Rd Unit 74
- 3965 Via Holgura
- 12364 Carmel Country Rd Unit C306
- 12936 Carmel Creek Rd Unit 63
- 3718 Mykonos Ln Unit 158
- 12368 Carmel Country Rd Unit 303
- 12370 Carmel Country Rd Unit 202
- 12372 Carmel Country Rd Unit 207
- 12372 Carmel Country Rd Unit 202
- 3877 Pell Place Unit 108
- 3857 Pell Place Unit 406
- 4271 Corte Favor
- 12550 Carmel Creek Rd Unit 100
- 4049 Carmel View Rd Unit 74
- 4049 Carmel View Rd Unit 75
- 4436 Heritage Glen Ln
- 12585 Ruette Alliante Unit 152
- 12540 Caminito Mira Del Mar
- 3856 Quarter Mile Dr
- 3545 Caminito el Rincon Unit 237
- 12820 Via Nieve
- 12820 Via Nieve Unit 77
- 12820 Via Nieve Unit 78
- 12820 Via Nieve Unit 76
- 12820 Via Nieve Unit 75
- 12820 Via Nieve Unit 74
- 12820 Via Nieve Unit 73
- 12820 Via Nieve Unit 72
- 12820 Via Nieve Unit 71
- 12810 Via Nieve Unit 70
- 12810 Via Nieve Unit 69
- 12810 Via Nieve Unit 68
- 12810 Via Nieve Unit 67
- 12810 Via Nieve Unit 66
- 12810 Via Nieve Unit 64
- 12810 Via Nieve Unit 62
- 12830 Via Nieve Unit 87
- 12830 Via Nieve Unit 83
- 12830 Via Nieve Unit 81
- 12830 Via Nieve Unit 79