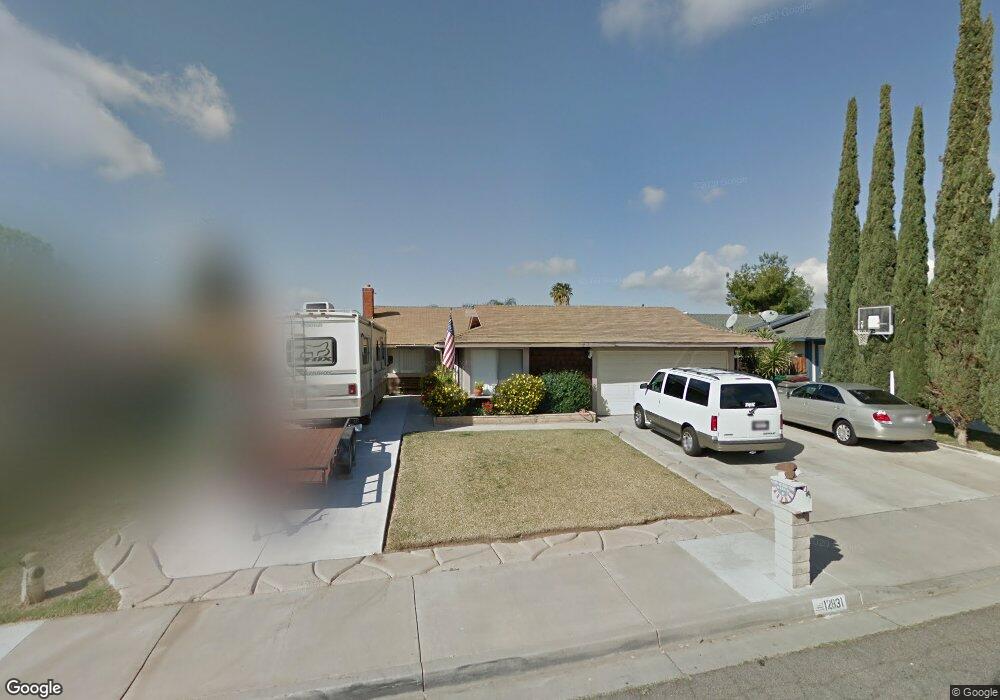
12831 Tamara Dr Moreno Valley, CA 92553
Bear Valley NeighborhoodEstimated Value: $532,233 - $596,000
4
Beds
2
Baths
1,844
Sq Ft
$303/Sq Ft
Est. Value
About This Home
This home is located at 12831 Tamara Dr, Moreno Valley, CA 92553 and is currently estimated at $558,058, approximately $302 per square foot. 12831 Tamara Dr is a home located in Riverside County with nearby schools including Butterfield Elementary School, Mountain View Middle, and Valley View High School.
Ownership History
Date
Name
Owned For
Owner Type
Purchase Details
Closed on
Oct 28, 1998
Sold by
Associates Home Equity Services Inc
Bought by
Jaime Miguel Z and Jaime Veronica
Current Estimated Value
Purchase Details
Closed on
Apr 3, 1998
Sold by
Durham Joseph
Bought by
Associates Home Equity Services Inc and Ford Consumer Finance Company
Purchase Details
Closed on
Jun 15, 1994
Sold by
Va
Bought by
Manning Aubrey D and Manning Deleta J
Home Financials for this Owner
Home Financials are based on the most recent Mortgage that was taken out on this home.
Original Mortgage
$94,500
Interest Rate
9.45%
Purchase Details
Closed on
May 31, 1994
Sold by
Manning Aubrey D and Manning Deleta J
Bought by
Durham Joseph
Home Financials for this Owner
Home Financials are based on the most recent Mortgage that was taken out on this home.
Original Mortgage
$94,500
Interest Rate
9.45%
Create a Home Valuation Report for This Property
The Home Valuation Report is an in-depth analysis detailing your home's value as well as a comparison with similar homes in the area
Home Values in the Area
Average Home Value in this Area
Purchase History
| Date | Buyer | Sale Price | Title Company |
|---|---|---|---|
| Jaime Miguel Z | $90,000 | -- | |
| Associates Home Equity Services Inc | $100,000 | Benefit Land Title Ins Co | |
| Manning Aubrey D | -- | First American Title Ins Co | |
| Durham Joseph | $105,000 | First American Title Ins Co |
Source: Public Records
Mortgage History
| Date | Status | Borrower | Loan Amount |
|---|---|---|---|
| Previous Owner | Durham Joseph | $94,500 |
Source: Public Records
Tax History Compared to Growth
Tax History
| Year | Tax Paid | Tax Assessment Tax Assessment Total Assessment is a certain percentage of the fair market value that is determined by local assessors to be the total taxable value of land and additions on the property. | Land | Improvement |
|---|---|---|---|---|
| 2025 | $1,697 | $141,062 | $31,336 | $109,726 |
| 2023 | $1,697 | $135,586 | $30,120 | $105,466 |
| 2022 | $1,636 | $132,929 | $29,530 | $103,399 |
| 2021 | $1,607 | $130,323 | $28,951 | $101,372 |
| 2020 | $1,591 | $128,988 | $28,655 | $100,333 |
| 2019 | $1,566 | $126,460 | $28,094 | $98,366 |
| 2018 | $1,537 | $123,982 | $27,545 | $96,437 |
| 2017 | $1,505 | $121,552 | $27,005 | $94,547 |
| 2016 | $1,491 | $119,170 | $26,476 | $92,694 |
| 2015 | $1,470 | $117,381 | $26,079 | $91,302 |
| 2014 | $1,374 | $115,083 | $25,569 | $89,514 |
Source: Public Records
Map
Nearby Homes
- 12771 Foreman Ave
- 24384 Fir Ave
- 24320 Fir Ave
- 25392 Todd Dr
- 12914 Coralberry St
- 12830 Perris Blvd Unit C10
- 12655 Kitching St
- 25084 Atwood Ave
- 12777 Perris Blvd
- 12789 Raenette Way
- 24921 Fir Ave
- 12601 Heartleaf St
- 12571 Heartleaf St
- 13315 Tacoma Dr
- 12638 Juneberry Ct
- 25403 Las Palomas Dr
- 24800 Myers Ave
- 25264 Drake Dr
- 12312 Marmont Place
- 24830 Lukewood Place
- 12843 Tamara Dr
- 12819 Tamara Dr
- 12797 Tamara Dr
- 12855 Tamara Dr
- 12832 Foreman Ave
- 12820 Foreman Ave
- 12844 Foreman Ave
- 12856 Foreman Ave
- 12796 Foreman Ave
- 12867 Tamara Dr
- 12785 Tamara Dr
- 12820 Tamara Dr
- 12798 Tamara Dr
- 12844 Tamara Dr
- 12868 Foreman Ave
- 12770 Foreman Ave
- 12856 Tamara Dr
- 12879 Tamara Dr
- 12773 Tamara Dr
- 12868 Tamara Dr