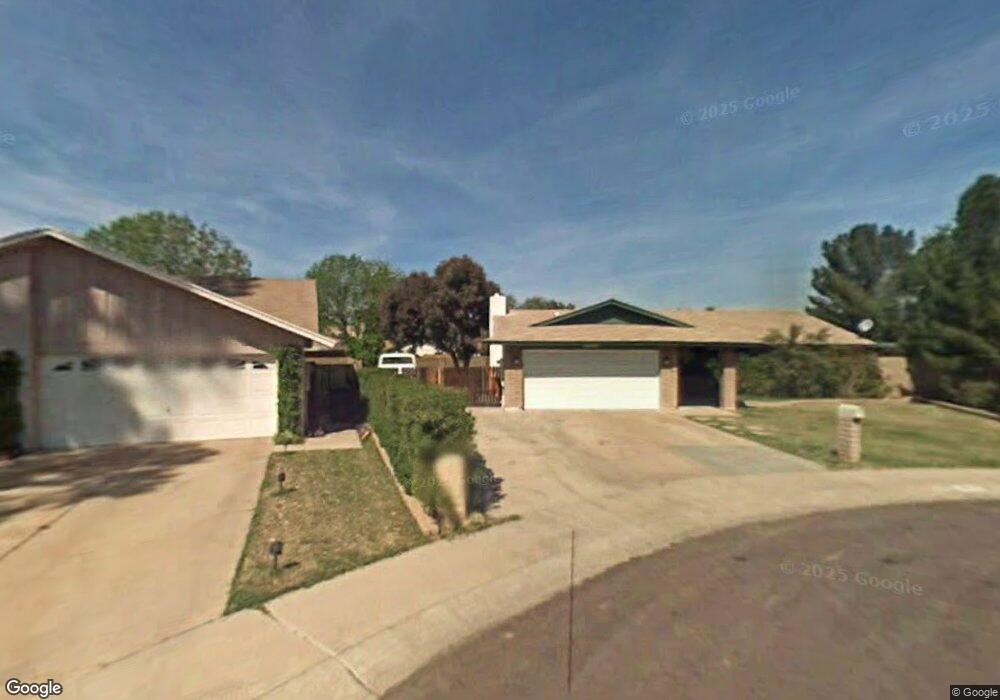
12834 N 40th Dr Phoenix, AZ 85029
North Mountain Village NeighborhoodEstimated Value: $336,348 - $409,000
3
Beds
2
Baths
1,554
Sq Ft
$244/Sq Ft
Est. Value
About This Home
This home is located at 12834 N 40th Dr, Phoenix, AZ 85029 and is currently estimated at $379,087, approximately $243 per square foot. 12834 N 40th Dr is a home located in Maricopa County with nearby schools including Chaparral Elementary School, Desert Foothills Middle School, and Moon Valley High School.
Ownership History
Date
Name
Owned For
Owner Type
Purchase Details
Closed on
May 19, 2021
Sold by
Christensen Ian
Bought by
Christensen Ian
Current Estimated Value
Home Financials for this Owner
Home Financials are based on the most recent Mortgage that was taken out on this home.
Original Mortgage
$161,850
Outstanding Balance
$146,215
Interest Rate
2.9%
Mortgage Type
New Conventional
Estimated Equity
$232,872
Purchase Details
Closed on
Sep 7, 2017
Sold by
Christensen Ian and Christensen Christin Ashley Doan
Bought by
Christensen Ian
Home Financials for this Owner
Home Financials are based on the most recent Mortgage that was taken out on this home.
Original Mortgage
$171,329
Interest Rate
3.93%
Mortgage Type
New Conventional
Purchase Details
Closed on
May 15, 2015
Sold by
Christensen Helen and Christensen Oren
Bought by
Christensen Oren
Purchase Details
Closed on
Feb 14, 2014
Sold by
Christensen Helen
Bought by
Christensen Oren
Home Financials for this Owner
Home Financials are based on the most recent Mortgage that was taken out on this home.
Original Mortgage
$171,830
Interest Rate
4.5%
Mortgage Type
FHA
Purchase Details
Closed on
Nov 12, 2012
Sold by
Kendall Holly
Bought by
Kendall Michael
Home Financials for this Owner
Home Financials are based on the most recent Mortgage that was taken out on this home.
Original Mortgage
$116,000
Interest Rate
3.35%
Mortgage Type
New Conventional
Purchase Details
Closed on
Mar 26, 2012
Sold by
Neal Mikael A and Sabatelli Sabrina K
Bought by
Equity Financial Planning Llc
Home Financials for this Owner
Home Financials are based on the most recent Mortgage that was taken out on this home.
Original Mortgage
$80,880
Interest Rate
3.83%
Mortgage Type
Purchase Money Mortgage
Purchase Details
Closed on
Jul 15, 2006
Sold by
Swim Jason R and Niccole Swim L
Bought by
Neal Mikael A and Sabatelli Sabrina K
Home Financials for this Owner
Home Financials are based on the most recent Mortgage that was taken out on this home.
Original Mortgage
$194,800
Interest Rate
6.64%
Mortgage Type
Purchase Money Mortgage
Purchase Details
Closed on
Aug 18, 2005
Sold by
Swim Jason
Bought by
Swim Jason R and Nicole Swim L
Purchase Details
Closed on
Aug 26, 2002
Sold by
Swim Nicole
Bought by
Swim Jason
Home Financials for this Owner
Home Financials are based on the most recent Mortgage that was taken out on this home.
Original Mortgage
$103,900
Interest Rate
7.5%
Create a Home Valuation Report for This Property
The Home Valuation Report is an in-depth analysis detailing your home's value as well as a comparison with similar homes in the area
Home Values in the Area
Average Home Value in this Area
Purchase History
We collect this data history from publicly available records. To have your information removed, we recommend requesting removal directly through your county’s website.
| Date | Buyer | Sale Price | Title Company |
|---|---|---|---|
| Christensen Ian | -- | Amrock Inc | |
| Christensen Ian | -- | Servicelink | |
| Christensen Oren | -- | None Available | |
| Christensen Oren | -- | Security Title Agency | |
| Christensen Ian | $175,000 | Security Title Agency | |
| Kendall Michael | -- | Security Title Agency | |
| Kendall Michael | $145,000 | Security Title Agency | |
| Equity Financial Planning Llc | $101,100 | None Available | |
| Neal Mikael A | $243,500 | Grand Canyon Title Agency In | |
| Swim Jason R | -- | Chicago Title Insurance Co | |
| Swim Jason | -- | Stewart Title | |
| Swim Jason | $129,900 | Stewart Title |
Source: Public Records
Mortgage History
We collect this data history from publicly available records. To have your information removed, we recommend requesting removal directly through your county’s website.
| Date | Status | Borrower | Loan Amount |
|---|---|---|---|
| Open | Christensen Ian | $161,850 | |
| Closed | Christensen Ian | $171,329 | |
| Closed | Christensen Ian | $171,830 | |
| Previous Owner | Kendall Michael | $116,000 | |
| Previous Owner | Equity Financial Planning Llc | $80,880 | |
| Previous Owner | Neal Mikael A | $194,800 | |
| Previous Owner | Swim Jason | $103,900 | |
| Closed | Swim Jason | $26,000 |
Source: Public Records
Tax History
| Year | Tax Paid | Tax Assessment Tax Assessment Total Assessment is a certain percentage of the fair market value that is determined by local assessors to be the total taxable value of land and additions on the property. | Land | Improvement |
|---|---|---|---|---|
| 2025 | $1,560 | $13,991 | -- | -- |
| 2024 | $1,470 | $13,324 | -- | -- |
| 2023 | $1,470 | $28,780 | $5,750 | $23,030 |
| 2022 | $1,418 | $22,330 | $4,460 | $17,870 |
| 2021 | $1,454 | $20,450 | $4,090 | $16,360 |
| 2020 | $1,415 | $18,900 | $3,780 | $15,120 |
| 2019 | $1,389 | $17,630 | $3,520 | $14,110 |
| 2018 | $1,350 | $16,200 | $3,240 | $12,960 |
| 2017 | $1,346 | $13,650 | $2,730 | $10,920 |
| 2016 | $1,322 | $12,920 | $2,580 | $10,340 |
| 2015 | $1,226 | $12,160 | $2,430 | $9,730 |
Source: Public Records
Map
Nearby Homes
- 4035 W Dahlia Dr
- 4020 W Sweetwater Ave
- 3950 W Aster Dr
- 3944 W Wood Dr
- 3916 W Wood Dr
- 12618 N 41st Ave
- 4041 W Pershing Ave
- 3935 W Willow Ave
- 4235 W Aster Dr
- 4310 W Dahlia Dr
- 3925 W Charter Oak Rd
- 4411 W Windrose Dr
- 3702 W Aster Dr
- 3739 W Columbine Dr
- 12810 N 44th Dr
- 13628 N 40th Dr
- 4146 W Desert Hills Dr
- 4452 W Windrose Dr
- 13019 N 36th Dr
- 12028 N 41st Dr
- 12838 N 40th Dr
- 12828 N 40th Dr
- 4036 W Dahlia Dr
- 4038 W Dahlia Dr
- 4027 W Sweetwater Ave
- 4021 W Sweetwater Ave
- 4031 W Sweetwater Ave
- 12837 N 40th Dr
- 4015 W Sweetwater Ave
- 4039 W Sweetwater Ave
- 12833 N 40th Dr
- 4040 W Dahlia Dr
- 4029 W Dahlia Dr
- 12827 N 40th Dr
- 4039 W Dahlia Dr
- 4009 W Sweetwater Ave
- 4043 W Sweetwater Ave
- 4023 W Dahlia Dr
- 4044 W Dahlia Dr
- 4043 W Dahlia Dr
Your Personal Tour Guide
Ask me questions while you tour the home.