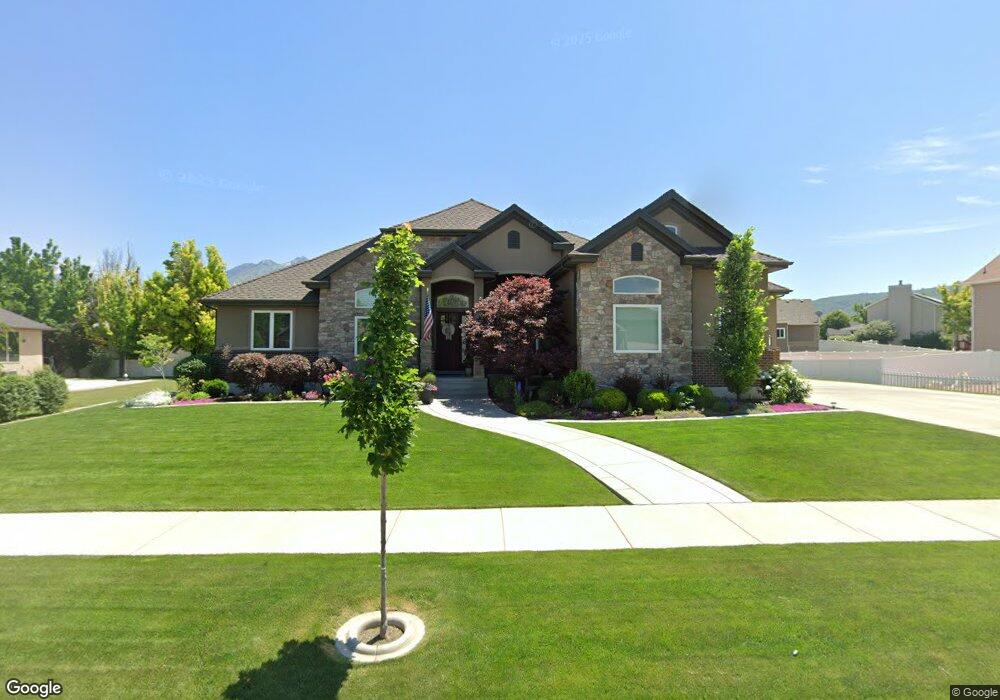
12837 S Pheasant View Dr Draper, UT 84020
Estimated Value: $812,000 - $1,080,000
3
Beds
3
Baths
2,550
Sq Ft
$381/Sq Ft
Est. Value
About This Home
This home is located at 12837 S Pheasant View Dr, Draper, UT 84020 and is currently estimated at $970,633, approximately $380 per square foot. 12837 S Pheasant View Dr is a home located in Salt Lake County with nearby schools including Corner Canyon High School, Draper Park Middle School, and Channing Hall.
Ownership History
Date
Name
Owned For
Owner Type
Purchase Details
Closed on
Jan 14, 2010
Sold by
Gates Barry A
Bought by
Bryner Justin Scott and Bryner Allison R
Current Estimated Value
Home Financials for this Owner
Home Financials are based on the most recent Mortgage that was taken out on this home.
Original Mortgage
$463,360
Outstanding Balance
$301,587
Interest Rate
4.78%
Mortgage Type
Purchase Money Mortgage
Estimated Equity
$669,046
Purchase Details
Closed on
Nov 1, 2004
Sold by
Sage Capital Llc
Bought by
Gates Barry A
Home Financials for this Owner
Home Financials are based on the most recent Mortgage that was taken out on this home.
Original Mortgage
$95,830
Interest Rate
5.69%
Mortgage Type
Purchase Money Mortgage
Create a Home Valuation Report for This Property
The Home Valuation Report is an in-depth analysis detailing your home's value as well as a comparison with similar homes in the area
Home Values in the Area
Average Home Value in this Area
Purchase History
| Date | Buyer | Sale Price | Title Company |
|---|---|---|---|
| Bryner Justin Scott | -- | Backman Title Services | |
| Gates Barry A | -- | Guardian Title |
Source: Public Records
Mortgage History
| Date | Status | Borrower | Loan Amount |
|---|---|---|---|
| Open | Bryner Justin Scott | $463,360 | |
| Previous Owner | Gates Barry A | $95,830 |
Source: Public Records
Tax History Compared to Growth
Tax History
| Year | Tax Paid | Tax Assessment Tax Assessment Total Assessment is a certain percentage of the fair market value that is determined by local assessors to be the total taxable value of land and additions on the property. | Land | Improvement |
|---|---|---|---|---|
| 2025 | $4,437 | $879,400 | $294,500 | $584,900 |
| 2024 | $4,437 | $847,500 | $283,600 | $563,900 |
| 2023 | $4,375 | $829,700 | $261,600 | $568,100 |
| 2022 | $4,576 | $838,200 | $256,500 | $581,700 |
| 2021 | $3,903 | $610,600 | $241,700 | $368,900 |
| 2020 | $3,770 | $559,100 | $212,000 | $347,100 |
| 2019 | $3,851 | $558,100 | $212,000 | $346,100 |
| 2018 | $3,680 | $545,100 | $196,400 | $348,700 |
| 2017 | $3,705 | $525,700 | $186,900 | $338,800 |
| 2016 | $3,653 | $503,700 | $179,500 | $324,200 |
| 2015 | $3,369 | $430,100 | $183,100 | $247,000 |
| 2014 | $3,137 | $391,300 | $168,700 | $222,600 |
Source: Public Records
Map
Nearby Homes
- 13080 S Crystal Spring Dr
- 479 Fox Farm Place
- 480 E Foxstone Cove
- 194 Bridgepark Cir
- 13181 S Woodridge Oak Dr
- 633 E Vandalay Ln
- 13128 S Day Meadow Dr
- 847 E Willow Springs Ln
- 902 E 12650 S
- 352 E Mistilake Ln Unit 20
- 12959 S Fort St
- 224 Spencer Peak Way Unit F6
- 196 E Spencer Peak Way Unit D6
- 13448 Saddle Ridge Dr
- 12073 S 300 E
- 164 E Spencer Peak Way Unit A12
- 587 Corner Canyon Dr
- 164 Spencer Peak Way Unit A6
- 468 E 12000 S
- 1263 E 13400 S
- 12837 Pheasant View Dr
- 12823 Pheasant View Dr
- 12823 S Pheasant View Dr
- 12867 Pheasant View Dr
- 451 Long Tail Cove
- 454 E Willow Moor Cove
- 454 Willow Moor Cove
- 457 Long Tail Cove
- 458 Willow Moor Cove
- 12832 Pheasant View Dr
- 12832 S Pheasant View Dr
- 398 Pheasant View Dr
- 398 E Pheasant View Dr
- 12889 Pheasant View Dr
- 12866 Pheasant View Dr
- 448 E Long Tail Cove
- 448 Long Tail Cove
- 12777 S 300 E
- 401 Draper Downs Dr
- 401 E Draper Downs Dr