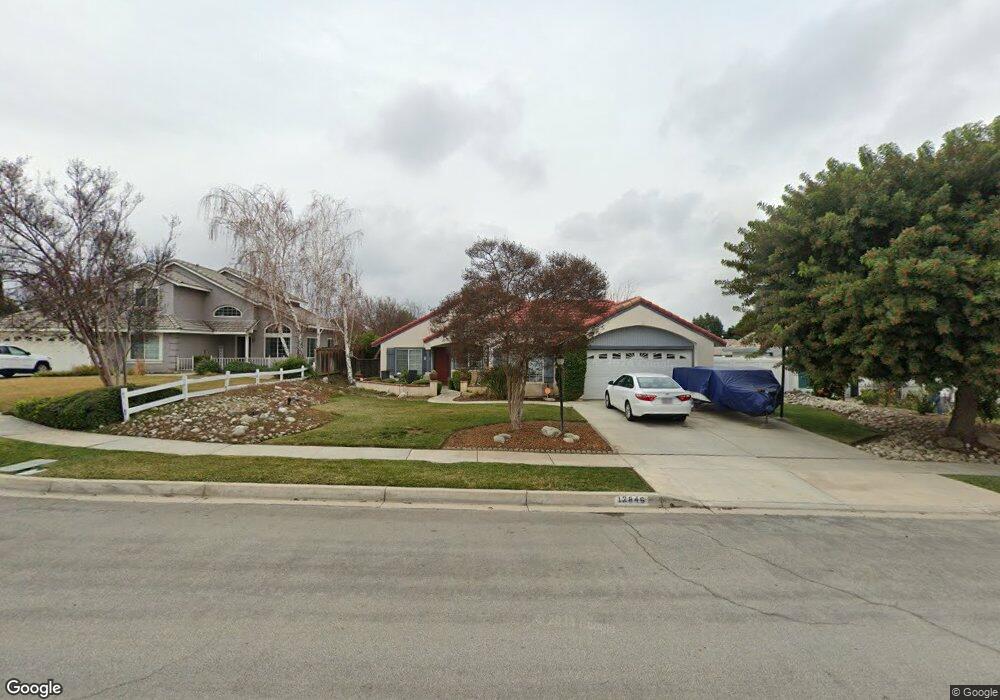
12846 Daisy Ct Yucaipa, CA 92399
Estimated Value: $598,421 - $653,000
3
Beds
2
Baths
1,760
Sq Ft
$355/Sq Ft
Est. Value
About This Home
This home is located at 12846 Daisy Ct, Yucaipa, CA 92399 and is currently estimated at $624,105, approximately $354 per square foot. 12846 Daisy Ct is a home located in San Bernardino County with nearby schools including Dunlap Elementary, Park View Middle School, and Yucaipa High School.
Ownership History
Date
Name
Owned For
Owner Type
Purchase Details
Closed on
Aug 13, 2013
Sold by
Casey Martha B
Bought by
Casey Martha B and The Martha B Casey Family Trus
Current Estimated Value
Purchase Details
Closed on
Apr 25, 2013
Sold by
Casey Martha B
Bought by
Casey Martha B
Purchase Details
Closed on
Jun 1, 2011
Sold by
Casey Martha B
Bought by
Casey Martha B and The Martha B Casey Family Trus
Purchase Details
Closed on
Oct 27, 1999
Sold by
Va
Bought by
Carver Kathleen G
Home Financials for this Owner
Home Financials are based on the most recent Mortgage that was taken out on this home.
Original Mortgage
$108,000
Interest Rate
7.82%
Purchase Details
Closed on
Sep 22, 1999
Sold by
Carver Kathleen J Dva
Bought by
Casey Martha B
Home Financials for this Owner
Home Financials are based on the most recent Mortgage that was taken out on this home.
Original Mortgage
$108,000
Interest Rate
7.82%
Purchase Details
Closed on
Aug 24, 1999
Sold by
Carver Gregory R Dva
Bought by
Carver Kathleen J
Home Financials for this Owner
Home Financials are based on the most recent Mortgage that was taken out on this home.
Original Mortgage
$108,000
Interest Rate
7.82%
Create a Home Valuation Report for This Property
The Home Valuation Report is an in-depth analysis detailing your home's value as well as a comparison with similar homes in the area
Home Values in the Area
Average Home Value in this Area
Purchase History
| Date | Buyer | Sale Price | Title Company |
|---|---|---|---|
| Casey Martha B | -- | None Available | |
| Casey Martha B | -- | None Available | |
| Casey Martha B | -- | None Available | |
| Carver Kathleen G | -- | First American Title Co | |
| Casey Martha B | $159,000 | First American Title Ins Co | |
| Carver Kathleen J | -- | -- |
Source: Public Records
Mortgage History
| Date | Status | Borrower | Loan Amount |
|---|---|---|---|
| Previous Owner | Casey Martha B | $108,000 |
Source: Public Records
Tax History
| Year | Tax Paid | Tax Assessment Tax Assessment Total Assessment is a certain percentage of the fair market value that is determined by local assessors to be the total taxable value of land and additions on the property. | Land | Improvement |
|---|---|---|---|---|
| 2025 | $3,202 | $244,382 | $61,095 | $183,287 |
| 2024 | $3,109 | $239,590 | $59,897 | $179,693 |
| 2023 | $3,027 | $234,893 | $58,723 | $176,170 |
| 2022 | $2,971 | $230,288 | $57,572 | $172,716 |
| 2021 | $2,920 | $225,772 | $56,443 | $169,329 |
| 2020 | $3,030 | $223,457 | $55,864 | $167,593 |
| 2019 | $2,933 | $219,076 | $54,769 | $164,307 |
| 2018 | $2,537 | $214,780 | $53,695 | $161,085 |
| 2017 | $2,481 | $210,568 | $52,642 | $157,926 |
| 2016 | $2,446 | $206,439 | $51,610 | $154,829 |
| 2015 | $2,504 | $203,338 | $50,835 | $152,503 |
| 2014 | $2,667 | $199,355 | $49,839 | $149,516 |
Source: Public Records
Map
Nearby Homes
- 12721 Royal Oak Ct
- 33507 Colorado St
- 33467 Washington Dr
- 12730 8th St
- 33241 Avenue D
- 33600 Calimesa Blvd Unit 111
- 33600 Calimesa Blvd Unit 55
- 33817 Liberty Rd
- 33820 Plum Tree Ln
- 33574 Washington Dr
- 0 Calimesa Blvd Unit IG25119291
- 32797 Avenue D
- 12591 7th St
- 12915 14th St
- 33848 Avenue G
- 92399 Yucaipa Blvd
- 33345 Wallace Way
- 13170 6th Place
- 33969 Avenue E
- 33153 Eagle Point Dr
- 12838 Daisy Ct
- 12854 Daisy Ct
- 12845 Clover Ct
- 12837 Clover Ct
- 12830 Daisy Ct
- 12853 Clover Ct
- 12862 Daisy Ct
- 12829 Clover Ct
- 12839 Daisy Ct
- 12847 Daisy Ct
- 12831 Daisy Ct
- 12861 Clover Ct
- 12855 Daisy Ct
- 12848 Brooks Ln
- 12823 Daisy Ct
- 12858 Brooks Ln
- 12863 Daisy Ct
- 12869 Clover Ct
- 33133 Lotus Ave
- 33158 Lotus Ave
Your Personal Tour Guide
Ask me questions while you tour the home.