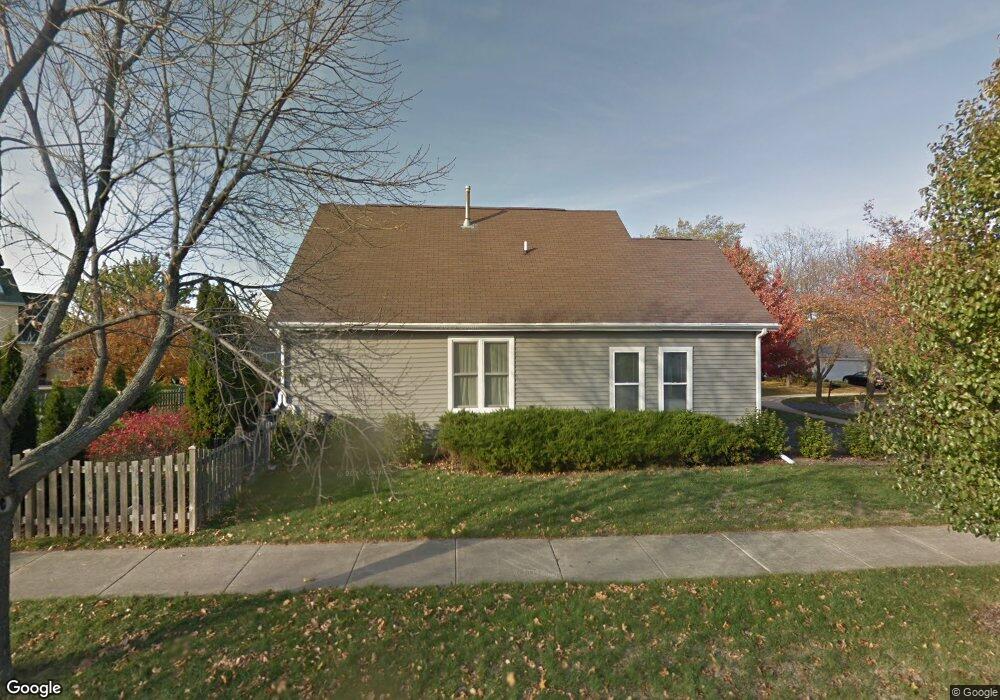
1285 Amaranth Dr Naperville, IL 60564
Far East NeighborhoodEstimated Value: $447,000 - $519,000
3
Beds
2
Baths
1,376
Sq Ft
$351/Sq Ft
Est. Value
About This Home
This home is located at 1285 Amaranth Dr, Naperville, IL 60564 and is currently estimated at $483,415, approximately $351 per square foot. 1285 Amaranth Dr is a home located in DuPage County with nearby schools including Owen Elementary School, Still Middle School, and Waubonsie Valley High School.
Ownership History
Date
Name
Owned For
Owner Type
Purchase Details
Closed on
Jan 31, 2007
Sold by
Mossi Mauricio E and Mossi Maria M
Bought by
Bonansinga Jon E and Bonansinga Allison J
Current Estimated Value
Home Financials for this Owner
Home Financials are based on the most recent Mortgage that was taken out on this home.
Original Mortgage
$212,000
Outstanding Balance
$127,754
Interest Rate
6.27%
Mortgage Type
Purchase Money Mortgage
Estimated Equity
$355,661
Purchase Details
Closed on
Aug 23, 2002
Sold by
Rolf Debra Jean
Bought by
Mossi Mauricio E and Mossi Maria M
Home Financials for this Owner
Home Financials are based on the most recent Mortgage that was taken out on this home.
Original Mortgage
$176,800
Interest Rate
5.75%
Mortgage Type
Purchase Money Mortgage
Purchase Details
Closed on
Nov 25, 1997
Sold by
Wiseman Hughes Enterprises Inc
Bought by
Rolf Debra Jean
Home Financials for this Owner
Home Financials are based on the most recent Mortgage that was taken out on this home.
Original Mortgage
$159,600
Interest Rate
7.75%
Create a Home Valuation Report for This Property
The Home Valuation Report is an in-depth analysis detailing your home's value as well as a comparison with similar homes in the area
Home Values in the Area
Average Home Value in this Area
Purchase History
| Date | Buyer | Sale Price | Title Company |
|---|---|---|---|
| Bonansinga Jon E | $265,000 | Law Title Insurance | |
| Mossi Mauricio E | $221,000 | Chicago Title Insurance Co | |
| Rolf Debra Jean | $168,000 | -- |
Source: Public Records
Mortgage History
| Date | Status | Borrower | Loan Amount |
|---|---|---|---|
| Open | Bonansinga Jon E | $212,000 | |
| Previous Owner | Mossi Mauricio E | $176,800 | |
| Previous Owner | Rolf Debra Jean | $159,600 |
Source: Public Records
Tax History
| Year | Tax Paid | Tax Assessment Tax Assessment Total Assessment is a certain percentage of the fair market value that is determined by local assessors to be the total taxable value of land and additions on the property. | Land | Improvement |
|---|---|---|---|---|
| 2024 | $8,885 | $124,856 | $32,463 | $92,393 |
| 2023 | $8,467 | $112,190 | $29,170 | $83,020 |
| 2022 | $8,181 | $103,560 | $26,710 | $76,850 |
| 2021 | $7,774 | $99,870 | $25,760 | $74,110 |
| 2020 | $8,061 | $99,870 | $25,760 | $74,110 |
| 2019 | $7,774 | $94,990 | $24,500 | $70,490 |
| 2018 | $7,082 | $92,330 | $23,620 | $68,710 |
| 2017 | $6,961 | $89,200 | $22,820 | $66,380 |
| 2016 | $6,833 | $85,600 | $21,900 | $63,700 |
| 2015 | $6,758 | $81,270 | $20,790 | $60,480 |
| 2014 | $6,394 | $70,170 | $19,040 | $51,130 |
| 2013 | $6,328 | $70,650 | $19,170 | $51,480 |
Source: Public Records
Map
Nearby Homes
- 1348 Amaranth Dr
- 4029 Broadmoor Cir
- 3819 Cadella Cir
- 4005 White Eagle Dr
- 4474 Chelsea Manor Cir
- 4263 Stableford Ln
- 4429 Chelsea Manor Cir
- 3730 Baybrook Dr Unit 26
- 4167 Chelsea Manor Cir
- 4110 Chelsea Manor Cir
- 4122 Chelsea Manor Cir
- 4139 Winslow Ct
- 3431 Charlemaine Dr
- 4204 Chelsea Manor Cir
- 3723 Edgebrook Ct
- 4177 Irving Rd
- 1576 Pine Lake Dr
- 2363 Fawn Lake Cir
- 3479 Charlemaine Dr
- 4158 Irving Rd
- 1275 Amaranth Dr Unit 1
- 1264 Chicory Ln
- 1254 Chicory Ln
- 1274 Chicory Ln
- 1280 Amaranth Dr
- 1286 Amaranth Dr Unit 1
- 1265 Amaranth Dr
- 1292 Amaranth Dr
- 1274 Amaranth Dr
- 1224 Chicory Ln Unit 1
- 1298 Amaranth Dr
- 1255 Amaranth Dr
- 1268 Amaranth Dr
- 1245 Amaranth Dr
- 1214 Chicory Ln
- 1265 Chicory Ln
- 1262 Amaranth Dr Unit 1
- 1255 Chicory Ln Unit 1
- 1195 Amaranth Dr
- 1225 Chicory Ln
Your Personal Tour Guide
Ask me questions while you tour the home.