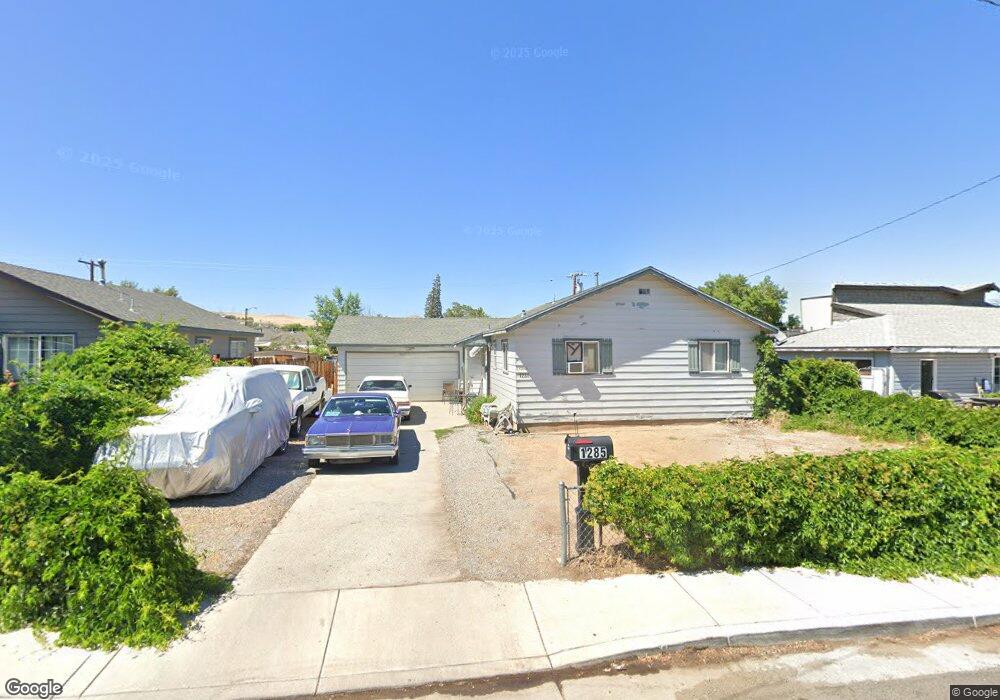
1285 Castle Way Reno, NV 89512
Northeast Reno NeighborhoodEstimated Value: $343,715 - $386,000
3
Beds
1
Bath
1,213
Sq Ft
$299/Sq Ft
Est. Value
About This Home
This home is located at 1285 Castle Way, Reno, NV 89512 and is currently estimated at $362,929, approximately $299 per square foot. 1285 Castle Way is a home located in Washoe County with nearby schools including Glenn Duncan STEM Academy, Fred W. Traner Middle School, and Procter R. Hug High School.
Ownership History
Date
Name
Owned For
Owner Type
Purchase Details
Closed on
May 5, 2011
Sold by
The Bank Of New York Mellon
Bought by
Diep Chan N and Diep Wanbin
Current Estimated Value
Purchase Details
Closed on
Dec 15, 2010
Sold by
Mettef Malik and Mettef Rachael
Bought by
The Bank Of New York Mellon and The Bank Of New York
Purchase Details
Closed on
Aug 29, 2003
Sold by
Swindle J R
Bought by
Mettef Malik and Mettef Rachael
Home Financials for this Owner
Home Financials are based on the most recent Mortgage that was taken out on this home.
Original Mortgage
$131,500
Interest Rate
6.3%
Mortgage Type
Unknown
Purchase Details
Closed on
May 27, 2003
Sold by
Farfsing Jerome F
Bought by
Swindle J R and Nevada Central Housing Trust #31102
Purchase Details
Closed on
Apr 30, 2003
Sold by
Breslin Lawrence P
Bought by
Farfsing Jerome
Create a Home Valuation Report for This Property
The Home Valuation Report is an in-depth analysis detailing your home's value as well as a comparison with similar homes in the area
Home Values in the Area
Average Home Value in this Area
Purchase History
| Date | Buyer | Sale Price | Title Company |
|---|---|---|---|
| Diep Chan N | $47,500 | Ticor Title Reno | |
| The Bank Of New York Mellon | $72,000 | Pasion Title Services | |
| Mettef Malik | $131,500 | Stewart Title Of Northern Nv | |
| Swindle J R | $90,000 | Stewart Title Of Northern Nv | |
| Farfsing Jerome | $65,000 | Stewart Title Of Northern Nv |
Source: Public Records
Mortgage History
| Date | Status | Borrower | Loan Amount |
|---|---|---|---|
| Previous Owner | Mettef Malik | $131,500 |
Source: Public Records
Tax History Compared to Growth
Tax History
| Year | Tax Paid | Tax Assessment Tax Assessment Total Assessment is a certain percentage of the fair market value that is determined by local assessors to be the total taxable value of land and additions on the property. | Land | Improvement |
|---|---|---|---|---|
| 2025 | $615 | $45,071 | $28,490 | $16,581 |
| 2024 | $615 | $41,606 | $25,235 | $16,371 |
| 2023 | $599 | $42,992 | $27,685 | $15,307 |
| 2022 | $582 | $34,357 | $21,910 | $12,447 |
| 2021 | $566 | $27,101 | $14,945 | $12,156 |
| 2020 | $548 | $26,071 | $14,140 | $11,931 |
| 2019 | $531 | $25,426 | $14,105 | $11,321 |
| 2018 | $516 | $19,999 | $9,135 | $10,864 |
| 2017 | $501 | $18,584 | $7,910 | $10,674 |
| 2016 | $489 | $17,733 | $7,070 | $10,663 |
| 2015 | $126 | $15,448 | $4,865 | $10,583 |
| 2014 | $475 | $13,970 | $3,990 | $9,980 |
| 2013 | -- | $12,423 | $2,765 | $9,658 |
Source: Public Records
Map
Nearby Homes
- 1525 Carville Dr
- 1680 Sutro St
- 1365 E 11th St
- 1281 E 10th St
- 1775 Carville Dr
- 920 Montello St
- 1412 E 9th St Unit 7
- 1885 Castle Way
- 1895 Citron St
- 1868 Fife Dr
- 1414 E 9th St Unit 4
- 1424 E 9th St Unit 2
- 1925 Citron St
- 1990 Trainer Way
- 1347 Butler St
- 1855 Mccloud Ave
- 1955 Wilder St
- 668 Spokane St
- 2424 Sutro St
- 565 Denslowe Dr
- 1265 Castle Way
- 1305 Castle Way
- 1290 Haddock Dr
- 1245 Castle Way
- 1325 Castle Way
- 1270 Haddock Dr
- 1310 Haddock Dr
- 1330 Haddock Dr
- 1250 Haddock Dr
- 1290 Castle Way
- 1345 Castle Way
- 1310 Castle Way
- 1270 Castle Way
- 1330 Castle Way
- 1350 Haddock Dr
- 1225 Castle Way
- 1365 Castle Way
- 1520 Sutro St
- 1230 Castle Way
- 1350 Castle Way