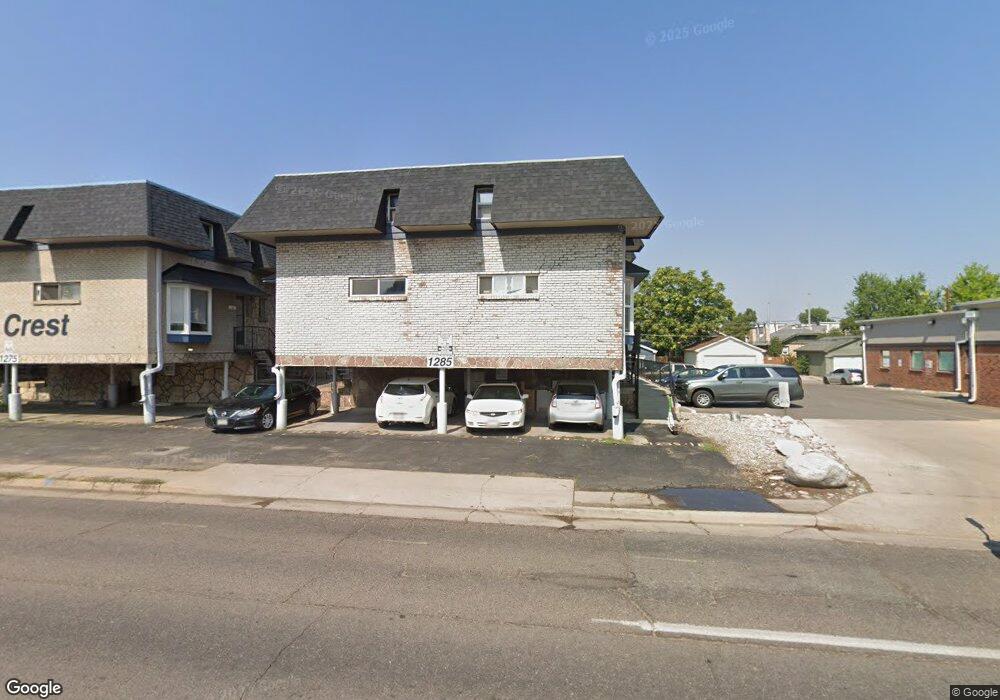
1285 Colorado Blvd Unit 12 Denver, CO 80206
Congress Park NeighborhoodEstimated Value: $131,000 - $157,000
1
Bed
1
Bath
389
Sq Ft
$368/Sq Ft
Est. Value
About This Home
This home is located at 1285 Colorado Blvd Unit 12, Denver, CO 80206 and is currently estimated at $143,315, approximately $368 per square foot. 1285 Colorado Blvd Unit 12 is a home located in Denver County with nearby schools including Teller Elementary School, Morey Middle School, and East High School.
Ownership History
Date
Name
Owned For
Owner Type
Purchase Details
Closed on
Dec 4, 2017
Sold by
Cooley Mathew J and Cooley Susan M
Bought by
Carroll Mathew D
Current Estimated Value
Purchase Details
Closed on
Dec 12, 2013
Sold by
Vancamp John and Vancamp Van Camp
Bought by
Cooley Mathew J and Cooley Susan M
Home Financials for this Owner
Home Financials are based on the most recent Mortgage that was taken out on this home.
Original Mortgage
$27,750
Interest Rate
3.62%
Mortgage Type
Adjustable Rate Mortgage/ARM
Purchase Details
Closed on
Nov 23, 2011
Sold by
Richards Brent
Bought by
Vancamp John and Vab Camp Theresa
Purchase Details
Closed on
Oct 22, 2002
Sold by
Meisenbach Craig
Bought by
Richards Brent
Purchase Details
Closed on
Jun 4, 1996
Sold by
Federal Home Loan Mortgage Corporation
Bought by
Brooks Harold E and Brooks Carol L
Purchase Details
Closed on
May 16, 1996
Sold by
Bozeman Nell L
Bought by
Otero S & L Assn
Create a Home Valuation Report for This Property
The Home Valuation Report is an in-depth analysis detailing your home's value as well as a comparison with similar homes in the area
Home Values in the Area
Average Home Value in this Area
Purchase History
| Date | Buyer | Sale Price | Title Company |
|---|---|---|---|
| Carroll Mathew D | $107,000 | Colorado Escrow & Title | |
| Cooley Mathew J | $37,000 | First American | |
| Vancamp John | $33,000 | First American | |
| Richards Brent | $38,000 | Guardian Title Agency Llc | |
| Brooks Harold E | -- | -- | |
| Otero S & L Assn | $23,621 | -- |
Source: Public Records
Mortgage History
| Date | Status | Borrower | Loan Amount |
|---|---|---|---|
| Previous Owner | Cooley Mathew J | $27,750 |
Source: Public Records
Tax History Compared to Growth
Tax History
| Year | Tax Paid | Tax Assessment Tax Assessment Total Assessment is a certain percentage of the fair market value that is determined by local assessors to be the total taxable value of land and additions on the property. | Land | Improvement |
|---|---|---|---|---|
| 2024 | $513 | $6,480 | $1,390 | $5,090 |
| 2023 | $502 | $6,480 | $1,390 | $5,090 |
| 2022 | $628 | $7,900 | $880 | $7,020 |
| 2021 | $607 | $8,130 | $910 | $7,220 |
| 2020 | $598 | $8,060 | $820 | $7,240 |
| 2019 | $581 | $8,060 | $820 | $7,240 |
| 2018 | $301 | $3,890 | $750 | $3,140 |
| 2017 | $300 | $3,890 | $750 | $3,140 |
| 2016 | $443 | $5,430 | $732 | $4,698 |
| 2015 | $424 | $5,430 | $732 | $4,698 |
| 2014 | $169 | $2,040 | $661 | $1,379 |
Source: Public Records
Map
Nearby Homes
- 1285 Colorado Blvd Unit 4
- 1172 Harrison St
- 1175 Harrison St
- 1233 Jackson St
- 1140 Harrison St
- 1321 Jackson St
- 1109 Harrison St
- 1271 Garfield St
- 4110 Hale Pkwy Unit 6C
- 4110 Hale Pkwy Unit 1E
- 4110 Hale Pkwy Unit 4J
- 4110 Hale Pkwy Unit 5G
- 4110 Hale Pkwy Unit 5F
- 1366 Garfield St Unit 403
- 1155 Ash St Unit 103
- 1155 Ash St Unit 804
- 1155 Ash St Unit 1204
- 1155 Ash St Unit 1202
- 1155 Ash St Unit 102
- 1155 Ash St Unit 908
- 1285 Colorado Blvd
- 1285 Colorado Blvd
- 1285 Colorado Blvd Unit 12859
- 1285 Colorado Blvd Unit 12858
- 1285 Colorado Blvd Unit 12857
- 1285 Colorado Blvd Unit 12856
- 1285 Colorado Blvd
- 1285 Colorado Blvd Unit 12854
- 1285 Colorado Blvd Unit 12853
- 1285 Colorado Blvd Unit 12852
- 1285 Colorado Blvd
- 1285 Colorado Blvd
- 1285 Colorado Blvd Unit 9
- 1285 Colorado Blvd Unit 10
- 1285 Colorado Blvd Unit 11
- 1285 Colorado Blvd Unit 3
- 1285 Colorado Blvd Unit 5
- 1285 Colorado Blvd Unit 2
- 1285 Colorado Blvd Unit 7
- 1285 Colorado Blvd Unit 8