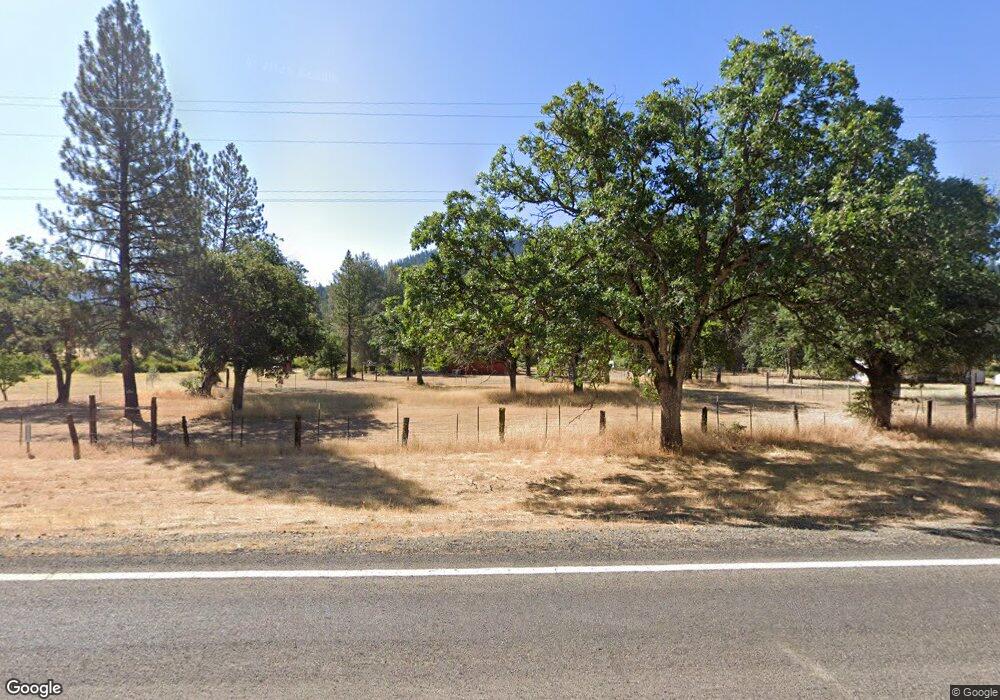
12850 State Highway 3 Hayfork, CA 96041
Estimated Value: $164,000 - $249,000
Studio
--
Bath
--
Sq Ft
8.42
Acres
About This Home
This home is located at 12850 State Highway 3, Hayfork, CA 96041 and is currently estimated at $205,953. 12850 State Highway 3 is a home with nearby schools including Hayfork High School.
Ownership History
Date
Name
Owned For
Owner Type
Purchase Details
Closed on
Mar 29, 2023
Sold by
Leclair Teena M
Bought by
Leclair Teena M and Garza Patrick
Current Estimated Value
Purchase Details
Closed on
Feb 23, 2022
Sold by
Dene Treece Carl
Bought by
Treece Teena M
Purchase Details
Closed on
Feb 11, 2022
Sold by
Dene Treece Carl
Bought by
Treece Teena M
Purchase Details
Closed on
Feb 24, 2005
Sold by
Treece Carl D
Bought by
Treece Carl D and Treece Teena M
Home Financials for this Owner
Home Financials are based on the most recent Mortgage that was taken out on this home.
Original Mortgage
$162,000
Interest Rate
5.73%
Mortgage Type
Stand Alone Refi Refinance Of Original Loan
Purchase Details
Closed on
Nov 25, 2003
Sold by
Va
Bought by
Treece Carl D
Home Financials for this Owner
Home Financials are based on the most recent Mortgage that was taken out on this home.
Original Mortgage
$125,000
Interest Rate
6.02%
Mortgage Type
Purchase Money Mortgage
Create a Home Valuation Report for This Property
The Home Valuation Report is an in-depth analysis detailing your home's value as well as a comparison with similar homes in the area
Home Values in the Area
Average Home Value in this Area
Purchase History
| Date | Buyer | Sale Price | Title Company |
|---|---|---|---|
| Leclair Teena M | -- | -- | |
| Treece Teena M | -- | -- | |
| Leclair Teena M | -- | None Listed On Document | |
| Treece Teena M | -- | -- | |
| Treece Carl D | -- | First American Title Co | |
| Treece Carl D | -- | First American Title Co |
Source: Public Records
Mortgage History
| Date | Status | Borrower | Loan Amount |
|---|---|---|---|
| Previous Owner | Treece Carl D | $162,000 | |
| Previous Owner | Treece Carl D | $125,000 |
Source: Public Records
Tax History
| Year | Tax Paid | Tax Assessment Tax Assessment Total Assessment is a certain percentage of the fair market value that is determined by local assessors to be the total taxable value of land and additions on the property. | Land | Improvement |
|---|---|---|---|---|
| 2025 | $1,314 | $109,180 | $41,584 | $67,596 |
| 2024 | $1,430 | $107,040 | $40,769 | $66,271 |
| 2023 | $1,430 | $104,942 | $39,970 | $64,972 |
| 2022 | $1,405 | $102,886 | $39,187 | $63,699 |
| 2021 | $290 | $100,869 | $38,419 | $62,450 |
| 2020 | $245 | $99,836 | $38,026 | $61,810 |
| 2019 | $110 | $97,880 | $37,281 | $60,599 |
| 2018 | $0 | $95,961 | $36,550 | $59,411 |
| 2017 | $110 | $94,081 | $35,834 | $58,247 |
| 2016 | $0 | $92,237 | $35,132 | $57,105 |
| 2015 | -- | $90,853 | $34,605 | $56,248 |
| 2014 | -- | $89,075 | $33,928 | $55,147 |
Source: Public Records
Map
Nearby Homes
- 12660 California 3
- 297 Frog Pond
- 13660 California 3
- 765 Barker Valley Rd
- 17950 Wildwood Rd
- 769 Barker Valley Rd
- 200 Creek Crossing Rd
- 2261 Barker Valley Rd
- 775 Barker Valley Rd
- 340 S Meadow Ln
- 250 S Meadow Ln
- 7821,41,51 California 3
- 13070 California 3
- 7201 California 3
- 2790 California 3
- 6985 California 3
- 331 N Meadow Ln
- 411 N Meadow Ln
- 1780 Summit Creek Rd
- 86 Sunshine Meadow Way
- 12750 State Highway 3
- 12791 State Highway 3
- 12667 State Highway 3
- 316 Nelson Rd
- 381 Nelson Rd
- 191 Nelson Rd
- 12621 State Highway 3
- 541 Nelson Rd
- 241 Nelson Rd
- 13070 State Highway 3
- 12461 State Highway 3
- 12410 State Highway 3
- 12410 California 3
- 12391 State Highway 3
- 12370 State Highway 3 None
- 380 Summit Creek Rd
- 12370 State Highway 3
Your Personal Tour Guide
Ask me questions while you tour the home.