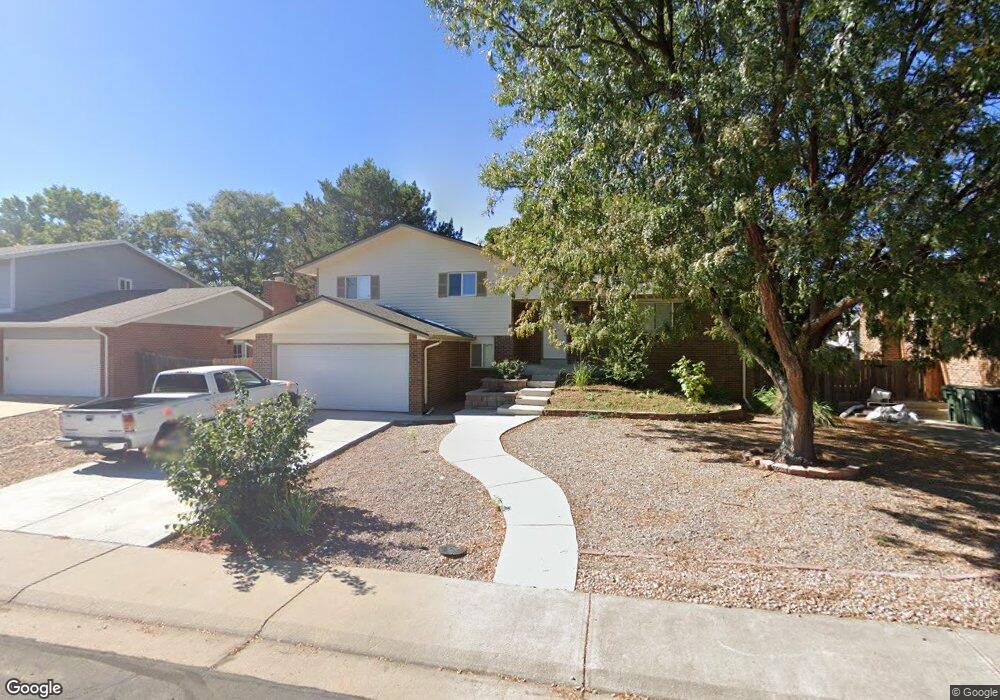
12853 Cherry Way Thornton, CO 80241
Country Hills NeighborhoodEstimated Value: $502,729 - $529,000
3
Beds
3
Baths
1,772
Sq Ft
$293/Sq Ft
Est. Value
About This Home
This home is located at 12853 Cherry Way, Thornton, CO 80241 and is currently estimated at $519,182, approximately $292 per square foot. 12853 Cherry Way is a home located in Adams County with nearby schools including Eagleview Elementary School, Rocky Top Middle School, and Horizon High School.
Ownership History
Date
Name
Owned For
Owner Type
Purchase Details
Closed on
Aug 18, 2021
Sold by
Patrick Beth
Bought by
Csh Property One Llc
Current Estimated Value
Purchase Details
Closed on
Jun 21, 2018
Sold by
Torrez Lawrence Daniel and Torrez Angela Kay
Bought by
Patrick Beth
Home Financials for this Owner
Home Financials are based on the most recent Mortgage that was taken out on this home.
Original Mortgage
$299,410
Interest Rate
4.5%
Mortgage Type
New Conventional
Purchase Details
Closed on
May 12, 2017
Sold by
Brodie Properties Llc
Bought by
Torrez Lawrence Daniel and Torrez Angela Kay
Home Financials for this Owner
Home Financials are based on the most recent Mortgage that was taken out on this home.
Original Mortgage
$348,570
Interest Rate
4.62%
Mortgage Type
FHA
Purchase Details
Closed on
Oct 12, 2016
Sold by
Stanley Robert Martin
Bought by
Brodie Properties Llc
Purchase Details
Closed on
Dec 28, 2009
Sold by
Bank Of America National Association
Bought by
Stanley Robert Martin
Home Financials for this Owner
Home Financials are based on the most recent Mortgage that was taken out on this home.
Original Mortgage
$152,192
Interest Rate
4.9%
Mortgage Type
FHA
Purchase Details
Closed on
Sep 11, 2009
Sold by
Carter Randell T
Bought by
Bank Of America National Association
Purchase Details
Closed on
Feb 20, 2007
Sold by
Carter Randell T
Bought by
Carter Randell T and Carter Darly S
Purchase Details
Closed on
Aug 31, 1999
Sold by
Mcnees Randy Lynn and Mcnees Laura Anne
Bought by
Carter Randell T
Home Financials for this Owner
Home Financials are based on the most recent Mortgage that was taken out on this home.
Original Mortgage
$150,700
Interest Rate
7.68%
Mortgage Type
FHA
Purchase Details
Closed on
Sep 2, 1994
Sold by
Deem Omer D and Deem Emma L
Bought by
Mcnees Randy Lynn and Mcnees Laura Anne
Home Financials for this Owner
Home Financials are based on the most recent Mortgage that was taken out on this home.
Original Mortgage
$123,450
Interest Rate
7.5%
Create a Home Valuation Report for This Property
The Home Valuation Report is an in-depth analysis detailing your home's value as well as a comparison with similar homes in the area
Home Values in the Area
Average Home Value in this Area
Purchase History
| Date | Buyer | Sale Price | Title Company |
|---|---|---|---|
| Csh Property One Llc | $501,000 | Wfg National Title | |
| Patrick Beth | $372,500 | First American Title | |
| Torrez Lawrence Daniel | $355,000 | Land Title Guarantee Co | |
| Brodie Properties Llc | $220,000 | Land Title Guarantee Co | |
| Stanley Robert Martin | $155,000 | Security Title | |
| Bank Of America National Association | -- | None Available | |
| Carter Randell T | -- | None Available | |
| Carter Randell T | $152,000 | Land Title | |
| Mcnees Randy Lynn | $129,990 | Commonwealth Land Title |
Source: Public Records
Mortgage History
| Date | Status | Borrower | Loan Amount |
|---|---|---|---|
| Previous Owner | Patrick Beth | $299,410 | |
| Previous Owner | Torrez Lawrence Daniel | $348,570 | |
| Previous Owner | Stanley Robert Martin | $152,192 | |
| Previous Owner | Carter Randell T | $150,700 | |
| Previous Owner | Mcnees Randy Lynn | $123,450 |
Source: Public Records
Tax History
| Year | Tax Paid | Tax Assessment Tax Assessment Total Assessment is a certain percentage of the fair market value that is determined by local assessors to be the total taxable value of land and additions on the property. | Land | Improvement |
|---|---|---|---|---|
| 2025 | $3,432 | $35,290 | $6,800 | $28,490 |
| 2024 | $3,432 | $32,440 | $6,250 | $26,190 |
| 2023 | $3,397 | $36,870 | $6,160 | $30,710 |
| 2022 | $2,980 | $27,050 | $6,320 | $20,730 |
| 2021 | $3,080 | $27,050 | $6,320 | $20,730 |
| 2020 | $3,110 | $27,880 | $6,510 | $21,370 |
| 2019 | $3,117 | $27,880 | $6,510 | $21,370 |
| 2018 | $2,377 | $20,660 | $6,840 | $13,820 |
| 2017 | $2,162 | $20,660 | $6,840 | $13,820 |
| 2016 | $1,931 | $17,970 | $3,660 | $14,310 |
| 2015 | $1,928 | $17,970 | $3,660 | $14,310 |
| 2014 | -- | $16,720 | $3,100 | $13,620 |
Source: Public Records
Map
Nearby Homes
- 12993 Birch Dr
- 12791 Clermont St
- 4756 E 129th Place
- 12804 Harrison St
- 13004 Harrison Dr
- 5024 E 127th Way
- 13064 Harrison Dr
- 13055 Harrison Dr
- 13068 Harrison Dr
- 3670 E 128th Place
- 5375 E 128th Dr
- 13222 Clermont Cir
- 13212 Clermont Cir
- 5341 E 129th Way
- 12698 Fairfax St
- 13064 Garfield Dr
- 12711 Colorado Blvd Unit 108A
- 12711 Colorado Blvd Unit 314C
- 12625 Fairfax St
- 4087 E 133rd Cir
- 12835 Cherry Way
- 12833 Cherry Way
- 12883 Cherry Way
- 12832 Clermont St
- 12822 Clermont St
- 12842 Clermont St
- 12823 Cherry Way
- 12903 Cherry Way
- 12862 Cherry Way
- 12842 Cherry Way
- 12852 Clermont St
- 12812 Clermont St
- 12906 Cherry Way
- 12822 Cherry Way
- 12813 Cherry Way
- 12907 Cherry Way
- 12862 Clermont St
- 12825 Clermont St
- 12873 Dexter Way
- 12912 Cherry Way
Your Personal Tour Guide
Ask me questions while you tour the home.