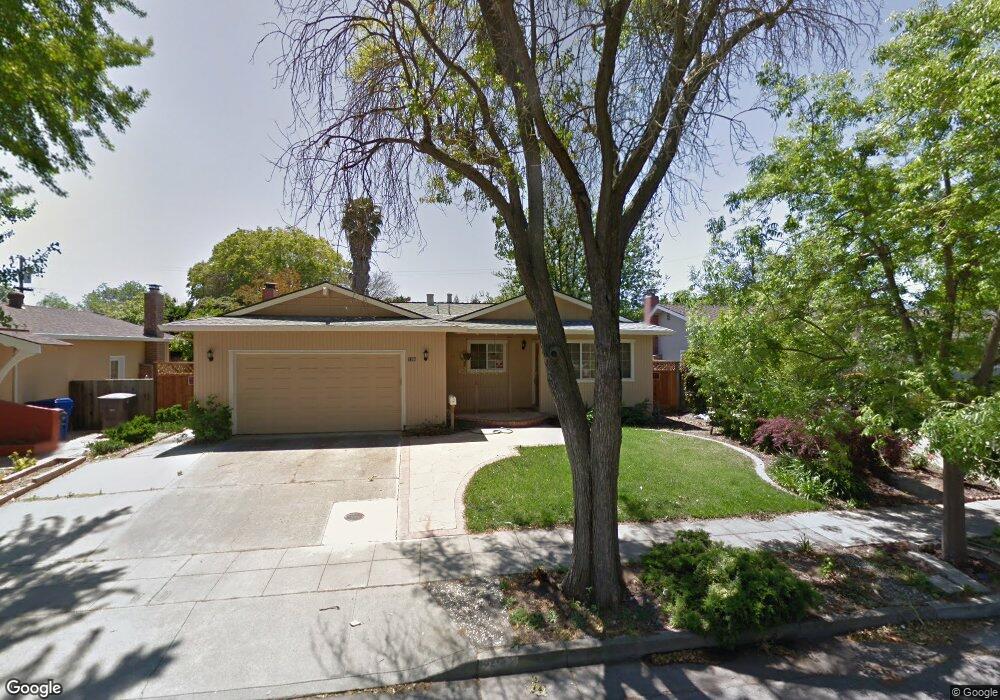
1286 Colleen Way Campbell, CA 95008
San Tomas Aquinos NeighborhoodEstimated Value: $1,841,000 - $2,266,000
4
Beds
2
Baths
1,398
Sq Ft
$1,443/Sq Ft
Est. Value
About This Home
This home is located at 1286 Colleen Way, Campbell, CA 95008 and is currently estimated at $2,017,080, approximately $1,442 per square foot. 1286 Colleen Way is a home located in Santa Clara County with nearby schools including George C. Payne Elementary School, Moreland Middle School, and Westmont High School.
Ownership History
Date
Name
Owned For
Owner Type
Purchase Details
Closed on
Nov 8, 2012
Sold by
Hsu Vicki Chia Chien
Bought by
Hsu Vicki Chia Chien
Current Estimated Value
Purchase Details
Closed on
Jun 15, 2010
Sold by
Lin Jeou Kai and Hsu Vicki Chia Chien
Bought by
Hsu Vicki Chia Chien and Lin Jeou Kai
Purchase Details
Closed on
Nov 14, 2001
Sold by
Lin Jeou Kai and Hsu Vicki C
Bought by
Lin Jeou Kai and Hsu Vicki C
Home Financials for this Owner
Home Financials are based on the most recent Mortgage that was taken out on this home.
Original Mortgage
$188,000
Interest Rate
6.57%
Purchase Details
Closed on
Oct 7, 1996
Sold by
Domenico Lo Porto
Bought by
Lin Jeou Kai and Hsu Chia Chien
Home Financials for this Owner
Home Financials are based on the most recent Mortgage that was taken out on this home.
Original Mortgage
$200,000
Interest Rate
8.1%
Create a Home Valuation Report for This Property
The Home Valuation Report is an in-depth analysis detailing your home's value as well as a comparison with similar homes in the area
Home Values in the Area
Average Home Value in this Area
Purchase History
| Date | Buyer | Sale Price | Title Company |
|---|---|---|---|
| Hsu Vicki Chia Chien | -- | None Available | |
| Hsu Vicki Chia Chien | -- | None Available | |
| Lin Jeou Kai | -- | Chicago Title Co | |
| Lin Jeou Kai | $250,000 | Santa Clara Land Title Co |
Source: Public Records
Mortgage History
| Date | Status | Borrower | Loan Amount |
|---|---|---|---|
| Closed | Lin Jeou Kai | $188,000 | |
| Closed | Lin Jeou Kai | $200,000 |
Source: Public Records
Tax History Compared to Growth
Tax History
| Year | Tax Paid | Tax Assessment Tax Assessment Total Assessment is a certain percentage of the fair market value that is determined by local assessors to be the total taxable value of land and additions on the property. | Land | Improvement |
|---|---|---|---|---|
| 2025 | $6,030 | $407,144 | $187,286 | $219,858 |
| 2024 | $6,030 | $399,162 | $183,614 | $215,548 |
| 2023 | $5,981 | $391,336 | $180,014 | $211,322 |
| 2022 | $5,911 | $383,664 | $176,485 | $207,179 |
| 2021 | $5,798 | $376,142 | $173,025 | $203,117 |
| 2020 | $5,670 | $372,286 | $171,251 | $201,035 |
| 2019 | $5,456 | $364,988 | $167,894 | $197,094 |
| 2018 | $5,302 | $357,832 | $164,602 | $193,230 |
| 2017 | $5,216 | $350,817 | $161,375 | $189,442 |
| 2016 | $4,912 | $343,939 | $158,211 | $185,728 |
| 2015 | $4,904 | $338,774 | $155,835 | $182,939 |
| 2014 | $4,752 | $332,139 | $152,783 | $179,356 |
Source: Public Records
Map
Nearby Homes
- 115 Superior Dr
- 2040 Orestes Way
- 111 N San Tomas Aquino Rd
- 3820 Ainsley Ct
- 146 English Rose Cir
- 3887 Via Salice
- 1629 Palo Santo Dr
- 4129 W Rincon Ave
- 990 Gale Dr
- 1918 Castro Dr
- 1803 Bucknall Rd
- 3816 Phoenix Ct
- 1815 Bucknall Rd
- 408 Darryl Dr
- 4088 Moreland Way
- 2025 Woodglen Dr
- 4497 Latimer Ave
- 3936 Braeburn Ct
- 2002 Mayfield Ave
- 433 W Rincon Ave Unit H
- 1274 Colleen Way
- 1294 Colleen Way
- 1283 Lorelei Ct
- 1273 Lorelei Ct
- 1260 Colleen Way
- 1302 Colleen Way
- 104 Welker Ct
- 1263 Lorelei Ct
- 1287 Colleen Way
- 1293 Colleen Way
- 96 Welker Ct
- 1246 Colleen Way
- 1285 Lorelei Ct
- 1301 Colleen Way
- 1261 Colleen Way
- 1247 Lorelei Ct
- 84 Welker Ct
- 1234 Colleen Way
- 1247 Colleen Way
- 1315 Colleen Way