1286 N Main St Boerne, TX 78006
About This Lot
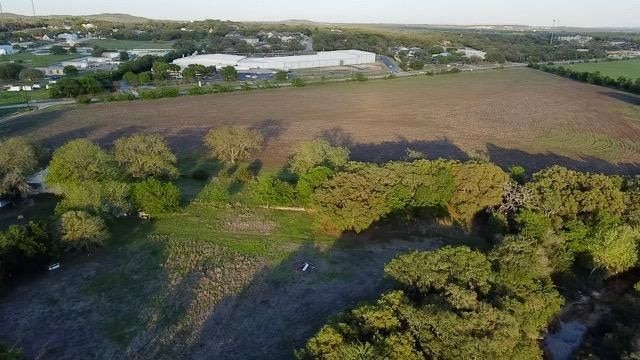
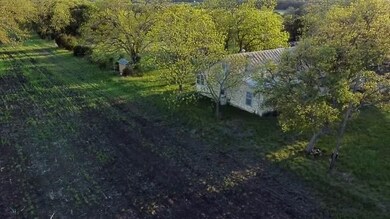
+/-31 acres at 1286 North Main
GENERAL DESCRIPTION:
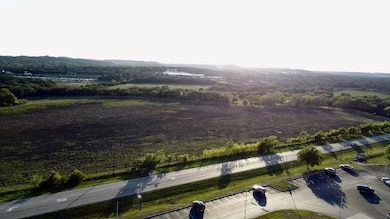
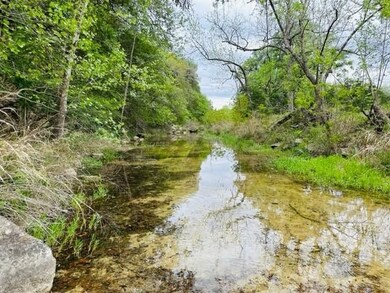
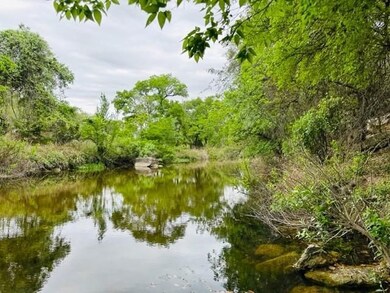
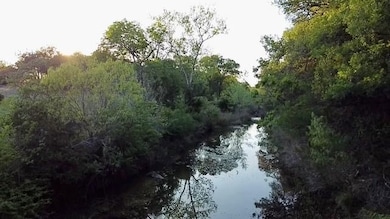
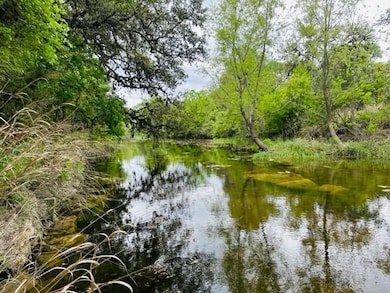
One of the largest contiguous commercial land tracts for sale in Boerne, TX with almost 1,700 feet of frontage on main street. This property also adjoins the crystal clear Cibolo creek with almost 1,000 feet of frontage on the high bank side giving it great views with little flood plain. Boerne consistently ranks as one of the top destinations in the country for residential and commercial growth along with several other categories including schools and its main street shopping corridor. There is also approx. 400 apartment units proposed on the adjoining land tract.
Has city utilities including sewer, water, and gas to the site.
+/-1,700 of frontage on North Main Street
+/-1,000 of frontage adjoining Cibolo Creek
Kendall county, but not within the city limits or CCN
No current zoning
Currently part of the FSA(farm service agency)
Under ag exemption and taxes are appox. $400 per year
Only about 1% of flood plain
Call broker for pricing

Property Details
Property Type
- Land
Est. Annual Taxes
- $3,217
Map
Home Values in the Area
Average Home Value in this Area
Tax History
| Year | Tax Paid | Tax Assessment Tax Assessment Total Assessment is a certain percentage of the fair market value that is determined by local assessors to be the total taxable value of land and additions on the property. | Land | Improvement |
|---|---|---|---|---|
| 2025 | $3,217 | $233,340 | $233,340 | -- |
| 2024 | $3,217 | $233,340 | $233,340 | -- |
| 2023 | $4,742 | $343,430 | $233,340 | $110,090 |
| 2022 | $195 | $124,908 | -- | -- |
| 2021 | $1,896 | $118,470 | $54,030 | $64,440 |
| 2020 | $1,757 | $103,230 | $49,530 | $53,700 |
| 2019 | $1,749 | $98,720 | $45,020 | $53,700 |
| 2018 | $1,749 | $98,720 | $45,020 | $53,700 |
| 2017 | $1,579 | $98,720 | $45,020 | $53,700 |
| 2016 | $1,436 | $82,820 | $28,710 | $54,110 |
| 2015 | $193 | $82,820 | $28,710 | $54,110 |
| 2014 | $193 | $82,820 | $28,710 | $54,110 |
| 2013 | -- | $82,820 | $28,710 | $54,110 |
Property History
| Date | Event | Price | List to Sale | Price per Sq Ft |
|---|---|---|---|---|
| 04/13/2023 04/13/23 | For Sale | -- | -- | -- |
- 110 Magnolia Cir
- 155 Magnolia Cir
- 107 Chama Dr
- 118 Chama Dr
- 1719 Sisterdale Rd
- 10 Chaparral Hill Rd
- 104 Creede St
- 220 Easy Money
- 109 N Oak Bluff Blvd
- LOT 6 Oak Acres Ln
- 30 Farm To Market 1376
- 1514 Farm To Market 1376
- 105 Wollschlaeger Dr
- 1 Carolyn Ln
- 24 Pfeiffer Rd
- 104 Arrowhead Ln
- 50 E Fabra Ln
- 101 Cibolo Crossing Dr
- 345 Johns Rd
- 2 Johns Rd
- 38400 Interstate 10 W Unit Apartment
- 518 Fabra St
- 1000 Diamond Dr Unit 1302
- 1000 Diamond Dr Unit 1301
- 225 North St
- 624 N Main St Unit 6
- 229 Doeskin Dr
- 131 E Granite Shores Dr
- 135 Oak Grove Dr
- 246 W Flowing River Dr
- 133 Hampton Cove
- 110 Surrey Dr
- 135 Bluebonnet Cir
- 311 E San Antonio Ave Unit 201
- 109 Krieg Dr
- 306 Harvest Garden
- 444 Herff St
- 150 Medical Dr
- 36025 I-10
- 136 W Evergreen St