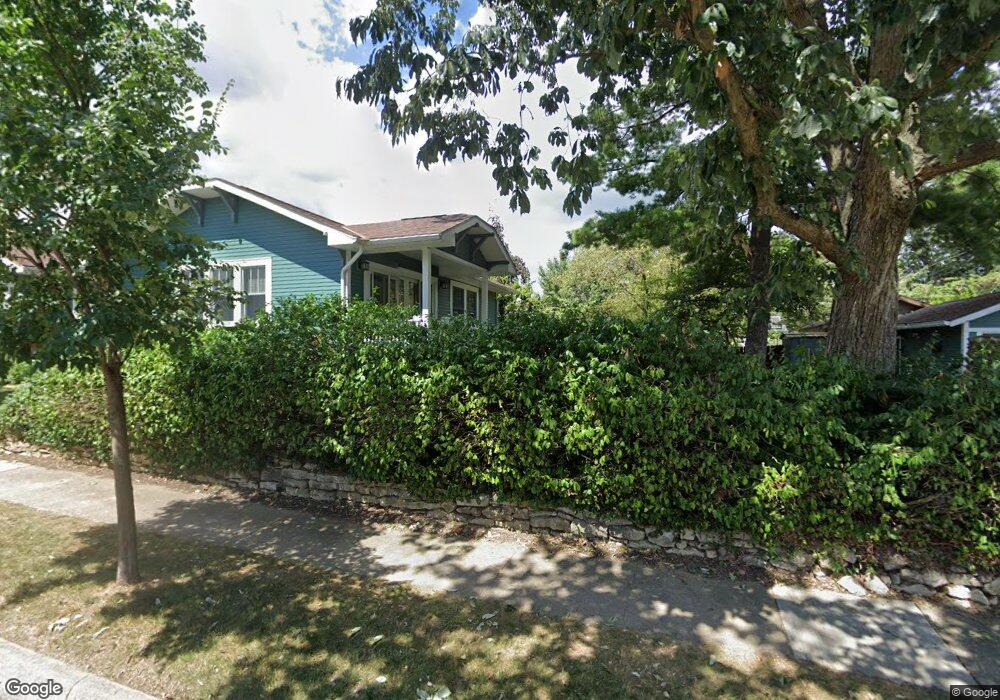
1286 W 2nd Ave Unit TWENTY Columbus, OH 43212
Estimated Value: $188,000 - $441,000
3
Beds
2
Baths
1,372
Sq Ft
$186/Sq Ft
Est. Value
About This Home
This home is located at 1286 W 2nd Ave Unit TWENTY, Columbus, OH 43212 and is currently estimated at $255,632, approximately $186 per square foot. 1286 W 2nd Ave Unit TWENTY is a home located in Franklin County with nearby schools including Robert Louis Stevenson Elementary School, Larson Middle School, and Grandview Heights High School.
Ownership History
Date
Name
Owned For
Owner Type
Purchase Details
Closed on
May 8, 2018
Sold by
Hill Lashawn D and Sullivan Cheryl Brooks
Bought by
Smith Barbara A
Current Estimated Value
Home Financials for this Owner
Home Financials are based on the most recent Mortgage that was taken out on this home.
Original Mortgage
$72,000
Outstanding Balance
$42,711
Interest Rate
4.44%
Mortgage Type
New Conventional
Estimated Equity
$212,921
Purchase Details
Closed on
Jan 6, 2006
Sold by
Carter Tausha and Thomas Fred H
Bought by
Hill Lashawn D
Home Financials for this Owner
Home Financials are based on the most recent Mortgage that was taken out on this home.
Original Mortgage
$26,400
Interest Rate
6.34%
Mortgage Type
Fannie Mae Freddie Mac
Purchase Details
Closed on
Aug 18, 1992
Bought by
Thomas Fred H
Create a Home Valuation Report for This Property
The Home Valuation Report is an in-depth analysis detailing your home's value as well as a comparison with similar homes in the area
Home Values in the Area
Average Home Value in this Area
Purchase History
| Date | Buyer | Sale Price | Title Company |
|---|---|---|---|
| Smith Barbara A | -- | None Available | |
| Hill Lashawn D | $20,000 | None Available | |
| Thomas Fred H | -- | -- |
Source: Public Records
Mortgage History
| Date | Status | Borrower | Loan Amount |
|---|---|---|---|
| Open | Smith Barbara A | $72,000 | |
| Previous Owner | Hill Lashawn D | $26,400 |
Source: Public Records
Tax History Compared to Growth
Tax History
| Year | Tax Paid | Tax Assessment Tax Assessment Total Assessment is a certain percentage of the fair market value that is determined by local assessors to be the total taxable value of land and additions on the property. | Land | Improvement |
|---|---|---|---|---|
| 2024 | $3,863 | $56,430 | $5,220 | $51,210 |
| 2023 | $2,554 | $56,430 | $5,220 | $51,210 |
| 2022 | $793 | $14,920 | $2,490 | $12,430 |
| 2021 | $794 | $14,920 | $2,490 | $12,430 |
| 2020 | $795 | $14,920 | $2,490 | $12,430 |
| 2019 | $1,316 | $12,570 | $2,070 | $10,500 |
| 2018 | $834 | $12,570 | $2,070 | $10,500 |
| 2017 | $1,412 | $12,570 | $2,070 | $10,500 |
| 2016 | $3,726 | $11,800 | $2,800 | $9,000 |
| 2015 | $1,376 | $11,800 | $2,800 | $9,000 |
| 2014 | $711 | $11,800 | $2,800 | $9,000 |
| 2013 | $730 | $13,300 | $3,115 | $10,185 |
Source: Public Records
Map
Nearby Homes
- 1297 Doten Ave
- 1225 Eastview Ave
- 1475 W 3rd Ave Unit 204
- 1240 Oxley Rd
- 1242 Oxley Rd
- 1095 W 3rd Ave
- 1093 W 3rd Ave
- 1083 W 3rd Ave
- 1111 Northwest Blvd Unit 113
- 1081 W 3rd Ave
- 1081 Northwest Blvd Unit 2
- 1129 Mulford Rd
- 932 Mcclain Rd
- 00 W 7th Ave
- 860 Palmer Rd
- 1364 W 7th Ave
- 1126 King Ave Unit 128
- 1000 Urlin Ave Unit 2007
- 1000 Urlin Ave Unit 520
- 1000 Urlin Ave Unit 605
- 1282 W 2nd Ave Unit TWENTY
- 1234 Hope Ave
- 1292 W 2nd Ave Unit TWENTY
- 1242 Hope Ave
- 1298 W 2nd Ave Unit TWENTY
- 1274 W 2nd Ave
- 1274 W 2nd Ave Unit 276
- 1246 Hope Ave
- 1272 W 2nd Ave Unit TWENTY
- 1220 Hope Ave
- 1268 W 2nd Ave
- 1252 Hope Ave
- 1266 W 2nd Ave Unit TWENTY
- 1271 W 2nd Ave Unit TWENTY
- 1214 Hope Ave
- 1262 W 2nd Ave
- 1265 W 2nd Ave Unit TWENTY
- 1258 Hope Ave
- 1257 W 2nd Ave
- 1241 Hope Ave