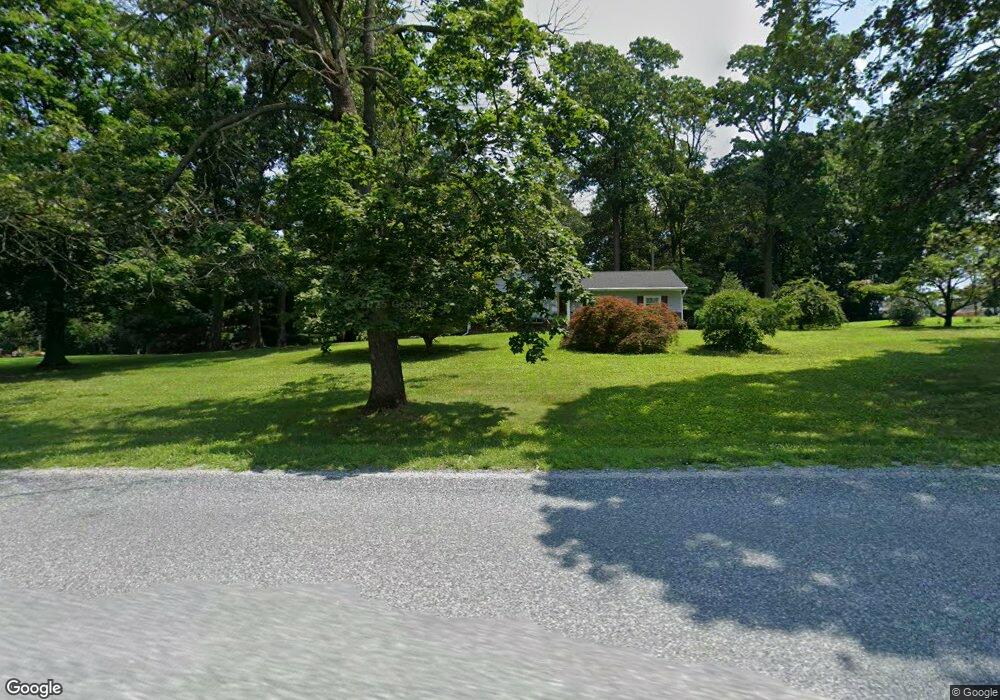
12863 Cross Roads Ave Felton, PA 17322
Estimated Value: $330,000 - $379,000
3
Beds
2
Baths
1,716
Sq Ft
$208/Sq Ft
Est. Value
About This Home
This home is located at 12863 Cross Roads Ave, Felton, PA 17322 and is currently estimated at $356,073, approximately $207 per square foot. 12863 Cross Roads Ave is a home located in York County with nearby schools including South Eastern Intermediate School, South Eastern Middle School, and Kennard-Dale High School.
Ownership History
Date
Name
Owned For
Owner Type
Purchase Details
Closed on
Oct 23, 2018
Sold by
Vanover Beverly A and Strevig Dawn E
Bought by
Strevig Dawn
Current Estimated Value
Home Financials for this Owner
Home Financials are based on the most recent Mortgage that was taken out on this home.
Original Mortgage
$136,000
Outstanding Balance
$118,852
Interest Rate
4.6%
Mortgage Type
New Conventional
Estimated Equity
$237,221
Purchase Details
Closed on
Jan 31, 2014
Sold by
Vanover Francis O and Vanover Beverly A
Bought by
Vanover Beverly A and Strevig Dawn E
Purchase Details
Closed on
Nov 20, 1972
Bought by
Vanover Francis O and Vanover Beverly A
Create a Home Valuation Report for This Property
The Home Valuation Report is an in-depth analysis detailing your home's value as well as a comparison with similar homes in the area
Home Values in the Area
Average Home Value in this Area
Purchase History
| Date | Buyer | Sale Price | Title Company |
|---|---|---|---|
| Strevig Dawn | -- | None Available | |
| Vanover Beverly A | -- | -- | |
| Vanover Francis O | $3,200 | -- |
Source: Public Records
Mortgage History
| Date | Status | Borrower | Loan Amount |
|---|---|---|---|
| Open | Strevig Dawn | $136,000 |
Source: Public Records
Tax History Compared to Growth
Tax History
| Year | Tax Paid | Tax Assessment Tax Assessment Total Assessment is a certain percentage of the fair market value that is determined by local assessors to be the total taxable value of land and additions on the property. | Land | Improvement |
|---|---|---|---|---|
| 2025 | $4,297 | $145,610 | $30,640 | $114,970 |
| 2024 | $4,297 | $145,610 | $30,640 | $114,970 |
| 2023 | $4,297 | $145,610 | $30,640 | $114,970 |
| 2022 | $4,297 | $145,610 | $30,640 | $114,970 |
| 2021 | $4,151 | $145,610 | $30,640 | $114,970 |
| 2020 | $4,151 | $145,610 | $30,640 | $114,970 |
| 2019 | $4,137 | $145,610 | $30,640 | $114,970 |
| 2018 | $4,137 | $145,610 | $30,640 | $114,970 |
| 2017 | $4,125 | $145,610 | $30,640 | $114,970 |
| 2016 | $0 | $145,610 | $30,640 | $114,970 |
| 2015 | -- | $145,610 | $30,640 | $114,970 |
| 2014 | -- | $145,610 | $30,640 | $114,970 |
Source: Public Records
Map
Nearby Homes
- 0 Seitz Rd
- 12706 High Point Rd
- 11983 Tree Ln
- 1059 Main Street Extension
- 276 Oakbrook Dr
- 16434 Cross Roads Ave
- 18 Oriole Cir
- 15792 Cross Mill Rd
- 151 Cold Stream Trail
- 4389 Hess Rd
- 2733 Manor Furnace Rd
- 2727 Manor Furnace Rd
- 7923 Hickory Rd
- 0 Oak Ridge Ave
- 290 Neff Rd
- 8287 Pleasant Valley Rd
- 3005 Acorn Ln
- 209 Forest Hills Rd
- 1151 Delta Rd
- 335 E Snyder Corner Rd
- 12827 Cross Roads Ave
- 12872 Cross Roads Ave
- 7332 Mountain Rd
- 7374 Mountain Rd
- 0 Cross Roads Ave
- 12791 Cross Roads Ave
- 12782 Cross Roads Ave
- 12751 Cross Roads Ave
- 7439 Mountain Rd
- 7408 Mountain Rd
- 12977 Laurel Hill Rd
- 12758 Cross Roads Ave
- 12732 Cross Roads Ave
- Lot 10 Crossroads Ave
- 13017 Cross Roads Ave
- 12708 Cross Roads Ave
- 12676 Cross Roads Ave
- 13059 Cross Roads Ave
- 7530 Mountain Rd
- 7527 Mountain Rd