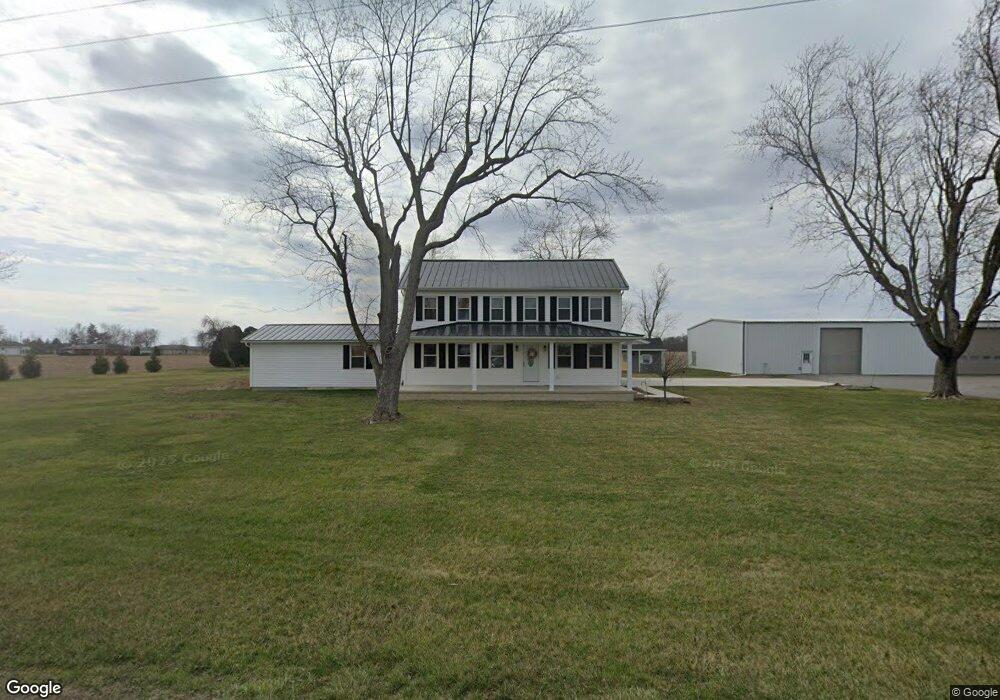
12864 State Route 65 Ottawa, OH 45875
Estimated Value: $348,686 - $483,000
4
Beds
3
Baths
2,560
Sq Ft
$153/Sq Ft
Est. Value
About This Home
This home is located at 12864 State Route 65, Ottawa, OH 45875 and is currently estimated at $391,672, approximately $152 per square foot. 12864 State Route 65 is a home located in Putnam County with nearby schools including Ottawa-Glandorf High School and Sts. Peter & Paul Catholic School.
Ownership History
Date
Name
Owned For
Owner Type
Purchase Details
Closed on
Nov 15, 2019
Sold by
Ellerbrock Nathan L and Ellerbrock Megan E
Bought by
Mansfield James Lee and Mansfield Cheryl Ann
Current Estimated Value
Purchase Details
Closed on
Jul 10, 2017
Sold by
Siefker Jerin M and Siefker Casey J
Bought by
Ellerbrock Nathan L and Ellerbrock Megan E
Home Financials for this Owner
Home Financials are based on the most recent Mortgage that was taken out on this home.
Original Mortgage
$217,800
Interest Rate
3.95%
Mortgage Type
New Conventional
Purchase Details
Closed on
Mar 9, 2009
Sold by
Siefker Jerin M and Luttfring Casey J
Bought by
Siefker Jerin M and Luttfring Casey J
Home Financials for this Owner
Home Financials are based on the most recent Mortgage that was taken out on this home.
Original Mortgage
$92,200
Interest Rate
5.38%
Mortgage Type
Purchase Money Mortgage
Create a Home Valuation Report for This Property
The Home Valuation Report is an in-depth analysis detailing your home's value as well as a comparison with similar homes in the area
Home Values in the Area
Average Home Value in this Area
Purchase History
| Date | Buyer | Sale Price | Title Company |
|---|---|---|---|
| Mansfield James Lee | $306,000 | None Available | |
| Ellerbrock Nathan L | $242,000 | Attorney | |
| Siefker Jerin M | $102,500 | None Available |
Source: Public Records
Mortgage History
| Date | Status | Borrower | Loan Amount |
|---|---|---|---|
| Previous Owner | Ellerbrock Nathan L | $217,800 | |
| Previous Owner | Siefker Jerin M | $92,200 |
Source: Public Records
Tax History Compared to Growth
Tax History
| Year | Tax Paid | Tax Assessment Tax Assessment Total Assessment is a certain percentage of the fair market value that is determined by local assessors to be the total taxable value of land and additions on the property. | Land | Improvement |
|---|---|---|---|---|
| 2024 | $3,065 | $98,200 | $7,320 | $90,880 |
| 2023 | $3,171 | $72,170 | $5,640 | $66,530 |
| 2022 | $2,648 | $72,171 | $5,639 | $66,532 |
| 2021 | $2,595 | $70,340 | $5,639 | $64,701 |
| 2020 | $2,610 | $60,810 | $4,700 | $56,110 |
| 2019 | $2,299 | $61,720 | $5,640 | $56,080 |
| 2018 | $2,276 | $61,720 | $5,640 | $56,080 |
| 2017 | $2,138 | $61,720 | $5,640 | $56,080 |
| 2016 | $2,138 | $60,810 | $4,700 | $56,110 |
| 2015 | $2,154 | $60,810 | $4,700 | $56,110 |
| 2014 | $1,468 | $42,370 | $4,700 | $37,670 |
| 2013 | $1,356 | $39,270 | $4,700 | $34,570 |
Source: Public Records
Map
Nearby Homes
- 370 S Thomas St
- 717 E 2nd St
- 740 E Main St
- 443 E 4th St
- 416 N Taft Ave
- 530 N Taft Ave
- 1709 S Agner St
- 717 & 717 1/2 & 721 E Third St
- 304 Oakview (Unit E) Dr
- 1854 S Agner St
- 715 N Perry St
- 1417 E 3rd St
- 195 Eastland Dr
- 0 Sapphire St Unit 225029940
- 202 S Main St
- 148 Pawnee Dr
- 309 Oakview Dr
- 331 Chippewa Dr
- #7 Oakview Dr
- #10 Oakview Dr