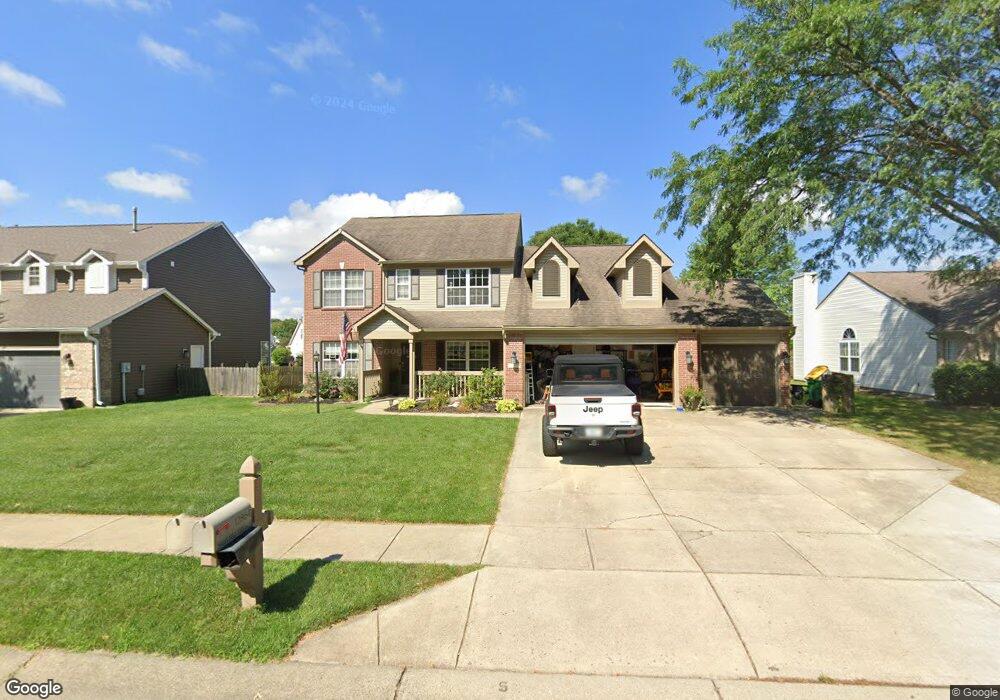
12864 Sweet Briar Pkwy Fishers, IN 46038
Estimated Value: $399,000 - $426,000
4
Beds
3
Baths
2,284
Sq Ft
$181/Sq Ft
Est. Value
About This Home
This home is located at 12864 Sweet Briar Pkwy, Fishers, IN 46038 and is currently estimated at $414,188, approximately $181 per square foot. 12864 Sweet Briar Pkwy is a home located in Hamilton County with nearby schools including Cumberland Road Elementary School, East Middle School, and Fishers Junior High School.
Ownership History
Date
Name
Owned For
Owner Type
Purchase Details
Closed on
Jul 23, 2008
Sold by
Garrett David W and Garrett Angela A
Bought by
Koll Tige A and Koll Holly R
Current Estimated Value
Home Financials for this Owner
Home Financials are based on the most recent Mortgage that was taken out on this home.
Original Mortgage
$200,665
Outstanding Balance
$131,695
Interest Rate
6.5%
Mortgage Type
FHA
Estimated Equity
$282,493
Purchase Details
Closed on
Jun 5, 2002
Sold by
Garrett David W and Murphy Angela A
Bought by
Garrett David W and Garrett Angela A
Home Financials for this Owner
Home Financials are based on the most recent Mortgage that was taken out on this home.
Original Mortgage
$148,167
Interest Rate
6.12%
Mortgage Type
Stand Alone Refi Refinance Of Original Loan
Create a Home Valuation Report for This Property
The Home Valuation Report is an in-depth analysis detailing your home's value as well as a comparison with similar homes in the area
Home Values in the Area
Average Home Value in this Area
Purchase History
| Date | Buyer | Sale Price | Title Company |
|---|---|---|---|
| Koll Tige A | -- | None Available | |
| Garrett David W | -- | -- |
Source: Public Records
Mortgage History
| Date | Status | Borrower | Loan Amount |
|---|---|---|---|
| Open | Koll Tige A | $200,665 | |
| Previous Owner | Garrett David W | $148,167 |
Source: Public Records
Tax History Compared to Growth
Tax History
| Year | Tax Paid | Tax Assessment Tax Assessment Total Assessment is a certain percentage of the fair market value that is determined by local assessors to be the total taxable value of land and additions on the property. | Land | Improvement |
|---|---|---|---|---|
| 2024 | $3,849 | $369,500 | $46,100 | $323,400 |
| 2023 | $3,849 | $344,000 | $46,100 | $297,900 |
| 2022 | $3,688 | $310,900 | $46,100 | $264,800 |
| 2021 | $3,167 | $265,800 | $46,100 | $219,700 |
| 2020 | $2,961 | $248,200 | $46,100 | $202,100 |
| 2019 | $2,788 | $234,200 | $42,100 | $192,100 |
| 2018 | $2,515 | $212,900 | $42,100 | $170,800 |
| 2017 | $2,448 | $210,300 | $42,100 | $168,200 |
| 2016 | $2,360 | $205,300 | $42,100 | $163,200 |
| 2014 | $1,942 | $189,600 | $42,100 | $147,500 |
| 2013 | $1,942 | $179,800 | $42,100 | $137,700 |
Source: Public Records
Map
Nearby Homes
- 10066 Perlita Place
- 13068 Lamarque Place
- 12966 Pleasant View Ln
- 13048 Ross Crossing
- 13125 Zinfandel Place
- 10150 Beresford Ct
- 11798 & 11842 E 131st St
- 10671 Pleasant View Ln
- 12991 Wingstem Ct
- 12959 Shandon Ln
- 10175 Pamona Ct
- 10713 Summerwood Ln
- 12638 Granite Ridge Cir
- 10873 Glazer Way
- 10523 Hollowood Ct
- 12783 Granite Ridge Cir
- 12662 Granite Ridge Cir
- 12807 Granite Ridge Cir
- 12650 Granite Ridge Cir
- 12687 Granite Ridge Cir
- 12854 Sweet Briar Pkwy
- 12874 Sweet Briar Pkwy
- 12844 Sweet Briar Pkwy
- 12884 Sweet Briar Pkwy
- 12857 Caliburn Ct
- 12834 Sweet Briar Pkwy
- 12837 Caliburn Ct
- 12904 Sweet Briar Pkwy
- 12877 Caliburn Ct
- 12824 Sweet Briar Pkwy
- 12817 Caliburn Ct
- 12924 Sweet Briar Pkwy
- 12856 Caliburn Ct
- 10202 Caliburn Ct
- 10222 Caliburn Ct
- 10171 Touchstone Dr
- 10191 Touchstone Dr
- 12836 Caliburn Ct
- 10151 Touchstone Dr
- 12816 Caliburn Ct