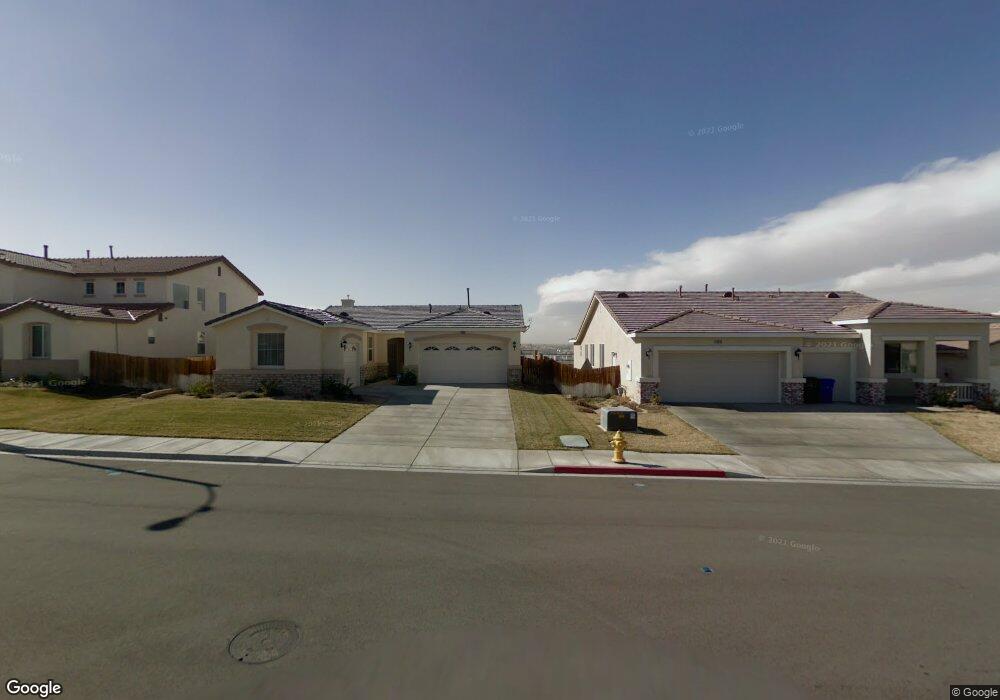
12866 High Vista St Victorville, CA 92395
Estimated Value: $409,090 - $444,000
3
Beds
2
Baths
1,701
Sq Ft
$251/Sq Ft
Est. Value
About This Home
This home is located at 12866 High Vista St, Victorville, CA 92395 and is currently estimated at $426,773, approximately $250 per square foot. 12866 High Vista St is a home located in San Bernardino County with nearby schools including Lomitas Elementary School, Mojave Vista Elementary School, and Lakeview Leadership Academy.
Ownership History
Date
Name
Owned For
Owner Type
Purchase Details
Closed on
May 19, 2018
Sold by
Kiyabu Jane L
Bought by
Kiyabu Randy S and Brown Rhonda K
Current Estimated Value
Home Financials for this Owner
Home Financials are based on the most recent Mortgage that was taken out on this home.
Original Mortgage
$185,250
Outstanding Balance
$159,506
Interest Rate
4.4%
Mortgage Type
New Conventional
Estimated Equity
$267,267
Purchase Details
Closed on
Mar 29, 2013
Sold by
Kiyabu James S
Bought by
Kiyabu James S and Kiyabu Jane L
Home Financials for this Owner
Home Financials are based on the most recent Mortgage that was taken out on this home.
Original Mortgage
$149,500
Interest Rate
3.47%
Mortgage Type
New Conventional
Purchase Details
Closed on
Jul 12, 2006
Sold by
Kiyabu James S
Bought by
Kiyabu James S and Kiyabu Jane L
Purchase Details
Closed on
Jan 30, 2006
Sold by
Spring Valley Ridge
Bought by
Kiyabu James S and Kiyabu Jane L
Home Financials for this Owner
Home Financials are based on the most recent Mortgage that was taken out on this home.
Original Mortgage
$174,000
Interest Rate
6.69%
Mortgage Type
Purchase Money Mortgage
Create a Home Valuation Report for This Property
The Home Valuation Report is an in-depth analysis detailing your home's value as well as a comparison with similar homes in the area
Home Values in the Area
Average Home Value in this Area
Purchase History
| Date | Buyer | Sale Price | Title Company |
|---|---|---|---|
| Kiyabu Randy S | -- | Act Title | |
| Kiyabu James S | -- | Advantage Title Inc | |
| Kiyabu James S | -- | Accommodation | |
| Kiyabu James S | $281,500 | Lawyers Title Co |
Source: Public Records
Mortgage History
| Date | Status | Borrower | Loan Amount |
|---|---|---|---|
| Open | Kiyabu Randy S | $185,250 | |
| Closed | Kiyabu James S | $149,500 | |
| Previous Owner | Kiyabu James S | $174,000 |
Source: Public Records
Tax History Compared to Growth
Tax History
| Year | Tax Paid | Tax Assessment Tax Assessment Total Assessment is a certain percentage of the fair market value that is determined by local assessors to be the total taxable value of land and additions on the property. | Land | Improvement |
|---|---|---|---|---|
| 2025 | $2,344 | $168,704 | $24,628 | $144,076 |
| 2024 | $2,344 | $165,396 | $24,145 | $141,251 |
| 2023 | $2,325 | $162,153 | $23,672 | $138,481 |
| 2022 | $2,291 | $158,974 | $23,208 | $135,766 |
| 2021 | $2,244 | $155,857 | $22,753 | $133,104 |
| 2020 | $2,353 | $154,259 | $22,520 | $131,739 |
| 2019 | $2,179 | $151,234 | $22,078 | $129,156 |
| 2018 | $2,213 | $148,269 | $21,645 | $126,624 |
| 2017 | $2,173 | $145,362 | $21,221 | $124,141 |
| 2016 | $2,135 | $142,512 | $20,805 | $121,707 |
| 2015 | $2,043 | $140,371 | $20,492 | $119,879 |
| 2014 | $2,007 | $137,622 | $20,091 | $117,531 |
Source: Public Records
Map
Nearby Homes
- 12848 Autumn Leaves Ave
- 729 Park Glen St
- 12896 Rain Shadow Rd
- 12802 Rain Shadow Rd
- 17849 Pebble Beach Dr
- 12775 Rain Shadow Rd
- 13090 Yellowstone Ave
- 17668 Park Terrace Ct
- 17895 Cumberland Way
- 13135 Yellowstone Ave
- 12840 Santa Anita Trail
- 13250 Yellowstone Ave
- 13090 Candleberry Ln
- 18065 Pebble Beach Dr
- 13145 Palos Grande Dr
- 13220 Tamarisk Rd
- 17705 Vista Point Dr
- 13190 Palos Grande Dr
- 17725 Vista Point Dr
- 12865 Amberwood Ln
- 12878 High Vista St
- 12854 High Vista St
- 12842 High Vista St
- 12882 High Vista St
- 12838 High Vista St
- 17643 View Mount Ct
- 12894 High Vista St
- 12871 High Vista St
- 12889 High Vista St
- 12826 High Vista St
- 17655 View Mount Ct
- 12906 High Vista St
- 17644 View Crest Ct
- 17653 High Valley
- 17653 High Valley
- 12814 High Vista St
- 17667 View Mount Ct
- 12911 High Vista St
- 17656 View Crest Ct