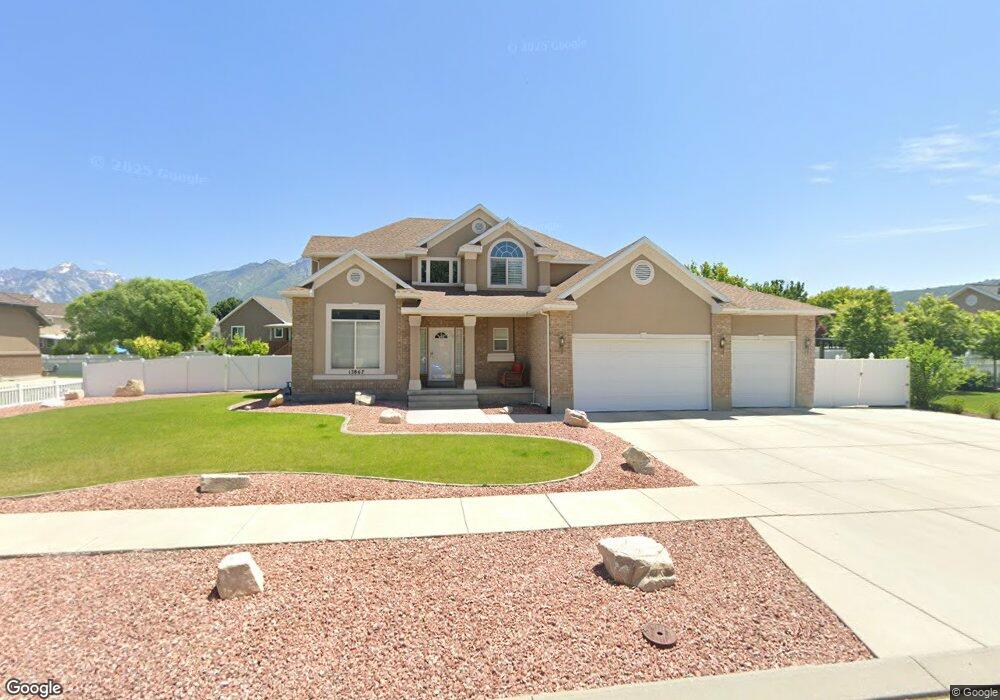
12867 Pheasant View Dr Draper, UT 84020
Estimated Value: $920,354 - $976,000
4
Beds
3
Baths
2,601
Sq Ft
$365/Sq Ft
Est. Value
About This Home
This home is located at 12867 Pheasant View Dr, Draper, UT 84020 and is currently estimated at $949,089, approximately $364 per square foot. 12867 Pheasant View Dr is a home located in Salt Lake County with nearby schools including Corner Canyon High School, Draper Park Middle School, and Channing Hall.
Ownership History
Date
Name
Owned For
Owner Type
Purchase Details
Closed on
Jan 25, 2024
Sold by
Radmall Karen A and Radmall John W
Bought by
John William Radmall And Karen A Radmall Trus and Radmall
Current Estimated Value
Purchase Details
Closed on
Sep 11, 2006
Sold by
Radmall Karen A
Bought by
Radmall John W and Radmall Karen A
Home Financials for this Owner
Home Financials are based on the most recent Mortgage that was taken out on this home.
Original Mortgage
$115,000
Interest Rate
6.56%
Mortgage Type
Credit Line Revolving
Purchase Details
Closed on
Nov 29, 2000
Sold by
Ivory Homes Ltd
Bought by
Radmall John W and Radmall Karen A
Home Financials for this Owner
Home Financials are based on the most recent Mortgage that was taken out on this home.
Original Mortgage
$252,700
Interest Rate
7.37%
Create a Home Valuation Report for This Property
The Home Valuation Report is an in-depth analysis detailing your home's value as well as a comparison with similar homes in the area
Home Values in the Area
Average Home Value in this Area
Purchase History
| Date | Buyer | Sale Price | Title Company |
|---|---|---|---|
| John William Radmall And Karen A Radmall Trus | -- | Richland Title Insurance Agenc | |
| Radmall John W | -- | Accommodation | |
| Radmall Karen A | -- | First American Title | |
| Radmall John W | -- | Guardian Title |
Source: Public Records
Mortgage History
| Date | Status | Borrower | Loan Amount |
|---|---|---|---|
| Previous Owner | Radmall Karen A | $115,000 | |
| Previous Owner | Radmall John W | $252,700 |
Source: Public Records
Tax History
| Year | Tax Paid | Tax Assessment Tax Assessment Total Assessment is a certain percentage of the fair market value that is determined by local assessors to be the total taxable value of land and additions on the property. | Land | Improvement |
|---|---|---|---|---|
| 2025 | $3,938 | $779,200 | $283,300 | $495,900 |
| 2024 | $3,938 | $752,300 | $272,800 | $479,500 |
| 2023 | $3,908 | $741,000 | $254,500 | $486,500 |
| 2022 | $4,099 | $750,700 | $249,500 | $501,200 |
| 2021 | $3,562 | $557,300 | $235,100 | $322,200 |
| 2020 | $3,221 | $477,700 | $206,300 | $271,400 |
| 2019 | $3,343 | $484,400 | $206,300 | $278,100 |
| 2016 | $3,108 | $428,500 | $177,700 | $250,800 |
Source: Public Records
Map
Nearby Homes
- 13160 S 300 E
- 13208 Sunset Glen Way
- 13176 Day Ct
- 633 E Vandalay Ln
- 265 E 13275 S
- 847 E Willow Springs Ln
- 352 E Mistilake Ln Unit 20
- 902 E 12650 S
- 311 E Unchartered Ln
- 12959 S Fort St
- 208 Spencer Peak Way Unit E2
- 13520 S Lone Rock Dr
- 12062 S 540 E
- 181 Mountain Peak Dr
- 246 W Golden Harvest Rd
- 13554 Bella Monte Dr Unit 113
- 296 E Ireland Ln Unit 101
- 261 E Concord Farm Ln Unit 6
- 834 E 12085 S
- 264 W 13165 S
- 12837 Pheasant View Dr
- 12889 Pheasant View Dr
- 12837 S Pheasant View Dr
- 451 Long Tail Cove
- 448 E Long Tail Cove
- 448 Long Tail Cove
- 401 Draper Downs Dr
- 401 E Draper Downs Dr
- 457 Long Tail Cove
- 12832 Pheasant View Dr
- 12832 S Pheasant View Dr
- 12866 Pheasant View Dr
- 12823 Pheasant View Dr
- 12823 S Pheasant View Dr
- 12898 S Long Tail Dr
- 12907 Pheasant View Dr
- 398 Pheasant View Dr
- 398 E Pheasant View Dr
- 458 Willow Moor Cove
- 387 Draper Downs Dr
Your Personal Tour Guide
Ask me questions while you tour the home.