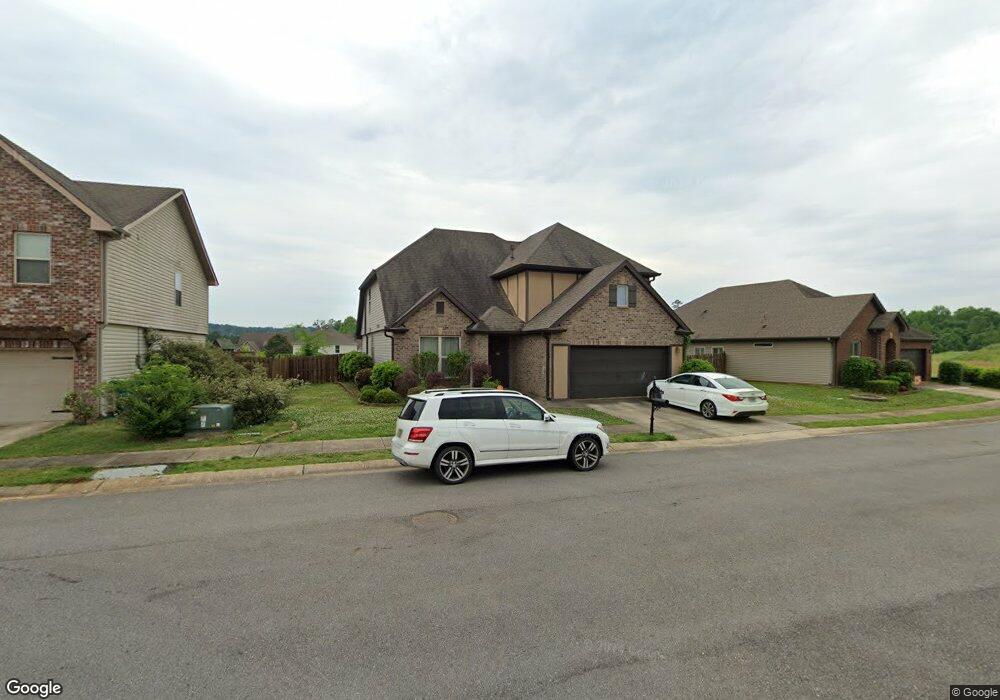
12868 Olmsted Cir Unit 2109 Mc Calla, AL 35111
Estimated Value: $314,754 - $332,000
4
Beds
3
Baths
2,334
Sq Ft
$138/Sq Ft
Est. Value
About This Home
This home is located at 12868 Olmsted Cir Unit 2109, Mc Calla, AL 35111 and is currently estimated at $322,189, approximately $138 per square foot. 12868 Olmsted Cir Unit 2109 is a home located in Tuscaloosa County with nearby schools including Lake View Elementary School, Brookwood Middle School, and Brookwood High School.
Ownership History
Date
Name
Owned For
Owner Type
Purchase Details
Closed on
Apr 15, 2020
Sold by
Hopkins George D
Bought by
Mims Lesley B
Current Estimated Value
Purchase Details
Closed on
Apr 20, 2011
Sold by
Dr Horton Inc - Birmingham
Bought by
Hopkins George D and Hopkins Lesley B
Home Financials for this Owner
Home Financials are based on the most recent Mortgage that was taken out on this home.
Original Mortgage
$190,826
Interest Rate
4.57%
Mortgage Type
VA
Purchase Details
Closed on
Jan 3, 2011
Sold by
Thornton New Home Sales In
Bought by
Dr Horton Inc - Birmingham
Create a Home Valuation Report for This Property
The Home Valuation Report is an in-depth analysis detailing your home's value as well as a comparison with similar homes in the area
Home Values in the Area
Average Home Value in this Area
Purchase History
| Date | Buyer | Sale Price | Title Company |
|---|---|---|---|
| Mims Lesley B | -- | -- | |
| Hopkins George D | $184,730 | -- | |
| Dr Horton Inc - Birmingham | $31,000 | -- |
Source: Public Records
Mortgage History
| Date | Status | Borrower | Loan Amount |
|---|---|---|---|
| Previous Owner | Hopkins George D | $190,826 |
Source: Public Records
Tax History Compared to Growth
Tax History
| Year | Tax Paid | Tax Assessment Tax Assessment Total Assessment is a certain percentage of the fair market value that is determined by local assessors to be the total taxable value of land and additions on the property. | Land | Improvement |
|---|---|---|---|---|
| 2024 | $978 | $59,920 | $6,200 | $53,720 |
| 2023 | $912 | $56,480 | $6,200 | $50,280 |
| 2022 | $740 | $49,180 | $6,200 | $42,980 |
| 2021 | $740 | $49,180 | $6,200 | $42,980 |
| 2020 | $1,407 | $21,980 | $3,100 | $18,880 |
| 2019 | $1,407 | $21,980 | $3,100 | $18,880 |
| 2018 | $1,407 | $21,980 | $3,100 | $18,880 |
| 2017 | $1,187 | $0 | $0 | $0 |
| 2016 | $1,182 | $0 | $0 | $0 |
| 2015 | $1,014 | $0 | $0 | $0 |
| 2014 | $1,184 | $21,930 | $3,100 | $18,830 |
Source: Public Records
Map
Nearby Homes
- 22806 Rimbred Ct
- 7823 Kimbrell Cutoff Rd
- 12772 Ironstone Dr
- 7947 Gristmill Dr
- 12766 Ironstone Dr
- 7787 Kimbrell Cutoff Rd
- 12760 Ironstone Dr
- 12754 Ironstone Dr
- 12880 Collier Curve
- 12748 Ironstone Dr
- 0 Tannehill Pkwy Unit 54712
- 12742 Ironstone Dr
- 12736 Ironstone Dr
- 12724 Ironstone Dr
- 22673 Fisher Dr
- 12718 Ironstone Dr
- The Cali Plan at Tannehill
- The Aaron Plan at Tannehill
- The Freeport Plan at Tannehill
- The Arden Plan at Tannehill
- 12868 Olmsted Cir
- 12864 Olmsted Cir
- 12864 Olmsted Cir Unit 2108
- 12874 Olmsted Cir
- 12874 Olmsted Cir
- 12874 Olmsted Cir Unit 2110
- 12860 Olmsted Cir
- 12860 Olmsted Cir Unit 2107
- 12883 Olmsted Cir
- 22805 Sanders Way
- 12871 Olmsted Cir
- 22806 Rimbred Ct Unit 2101
- 22798 Rimbred Ct
- 22812 Rimbred Ct
- 22812 Rimbred Ct Unit 2102
- 22838 Rimbred Ct
- 12877 Olmsted Cir
- 12877 Olmsted Cir Unit 2*42
- 22844 Rimbred Ct
- 22844 Rimbred Ct Unit 2106