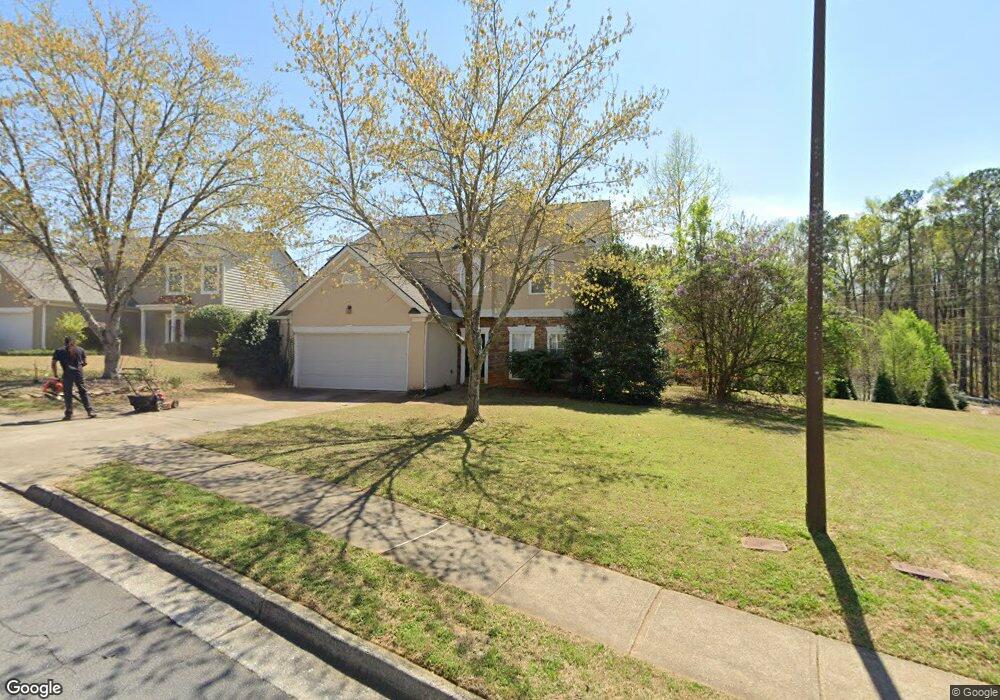
1287 Everwood Dr SW Marietta, GA 30008
Southwestern Marietta NeighborhoodEstimated Value: $375,475 - $419,000
3
Beds
3
Baths
2,159
Sq Ft
$185/Sq Ft
Est. Value
About This Home
This home is located at 1287 Everwood Dr SW, Marietta, GA 30008 and is currently estimated at $399,369, approximately $184 per square foot. 1287 Everwood Dr SW is a home located in Cobb County with nearby schools including Birney Elementary School, Smitha Middle School, and Osborne High School.
Ownership History
Date
Name
Owned For
Owner Type
Purchase Details
Closed on
Oct 31, 2018
Sold by
Johnson Dianna D
Bought by
Bradford Sheneka Nicole
Current Estimated Value
Home Financials for this Owner
Home Financials are based on the most recent Mortgage that was taken out on this home.
Original Mortgage
$198,850
Outstanding Balance
$172,685
Interest Rate
4.7%
Mortgage Type
New Conventional
Estimated Equity
$226,684
Purchase Details
Closed on
Nov 30, 1998
Sold by
Johnson Gerald L
Bought by
Johnson Dianna D
Home Financials for this Owner
Home Financials are based on the most recent Mortgage that was taken out on this home.
Original Mortgage
$114,000
Interest Rate
6.72%
Mortgage Type
New Conventional
Purchase Details
Closed on
May 7, 1997
Sold by
Centex Homes
Bought by
Johnson Gerald L and Johnson Dianna D
Home Financials for this Owner
Home Financials are based on the most recent Mortgage that was taken out on this home.
Original Mortgage
$12,000
Interest Rate
7.98%
Mortgage Type
New Conventional
Create a Home Valuation Report for This Property
The Home Valuation Report is an in-depth analysis detailing your home's value as well as a comparison with similar homes in the area
Home Values in the Area
Average Home Value in this Area
Purchase History
| Date | Buyer | Sale Price | Title Company |
|---|---|---|---|
| Bradford Sheneka Nicole | $205,000 | -- | |
| Johnson Dianna D | -- | -- | |
| Johnson Gerald L | $133,600 | -- |
Source: Public Records
Mortgage History
| Date | Status | Borrower | Loan Amount |
|---|---|---|---|
| Open | Bradford Sheneka Nicole | $198,850 | |
| Previous Owner | Johnson Dianna D | $114,000 | |
| Previous Owner | Johnson Gerald L | $12,000 |
Source: Public Records
Tax History Compared to Growth
Tax History
| Year | Tax Paid | Tax Assessment Tax Assessment Total Assessment is a certain percentage of the fair market value that is determined by local assessors to be the total taxable value of land and additions on the property. | Land | Improvement |
|---|---|---|---|---|
| 2025 | $4,494 | $169,424 | $30,000 | $139,424 |
| 2024 | $4,497 | $169,424 | $30,000 | $139,424 |
| 2023 | $3,085 | $129,344 | $13,600 | $115,744 |
| 2022 | $3,926 | $129,344 | $13,600 | $115,744 |
| 2021 | $2,722 | $89,676 | $13,600 | $76,076 |
| 2020 | $2,722 | $89,676 | $13,600 | $76,076 |
| 2019 | $2,416 | $79,608 | $12,000 | $67,608 |
| 2018 | $2,416 | $79,608 | $12,000 | $67,608 |
| 2017 | $2,007 | $69,804 | $12,000 | $57,804 |
| 2016 | $2,007 | $69,804 | $12,000 | $57,804 |
| 2015 | $1,568 | $53,216 | $16,000 | $37,216 |
| 2014 | $1,581 | $53,216 | $0 | $0 |
Source: Public Records
Map
Nearby Homes
- 1308 Willamette Way
- 2964 Edgemont Ln SW
- 3075 Milford Chase SW
- 1086 Mornington Way
- 1345 Windage Ct SW Unit 6
- 3004 Michael Dr SW
- 2907 Crest Ridge Ct SW
- 1427 Lost Bridge Rd
- 2615 Windage Dr SW
- 3123 Milford Chase SW
- 1104 Havel Dr SW
- 1020 Hicksmil Dr SW
- 1105 Woodleigh Rd SW
- 1108 Byers Dr SW
- 2940 Caller Ct SW
- 3141 Holbrook Dr SW
- 959 Old Milford Church Rd SW
- 1285 Everwood Dr SW Unit 1
- 1283 Everwood Dr SW
- 1286 Everwood Dr SW Unit 1
- 1372 Willamette Way
- 1368 Willamette Way
- 1281 Everwood Dr SW Unit 1
- 1284 Everwood Dr SW Unit 1
- 1364 Willamette Way
- 1360 Willamette Way
- 2824 Everwood Pointe SW
- 2825 Everwood Pointe SW Unit 1
- 1279 Everwood Dr SW
- 1280 Everwood Dr SW Unit 1
- 1356 Willamette Way
- 1352 Willamette Way
- 1371 Willamette Way
- 1367 Willamette Way
- 1278 Everwood Dr SW
- 1348 Willamette Way
- 1277 Everwood Dr SW Unit 1