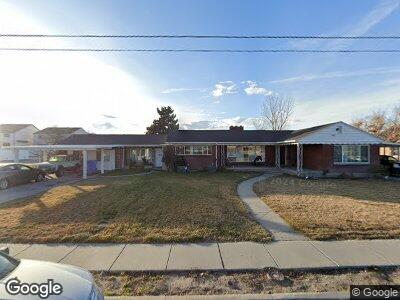
12874 S 1830 W Riverton, UT 84065
Estimated Value: $590,512 - $918,000
7
Beds
3
Baths
2,763
Sq Ft
$273/Sq Ft
Est. Value
About This Home
This home is located at 12874 S 1830 W, Riverton, UT 84065 and is currently estimated at $754,256, approximately $272 per square foot. 12874 S 1830 W is a home located in Salt Lake County with nearby schools including Riverton School, Hidden Valley Middle School, and Riverton High School.
Ownership History
Date
Name
Owned For
Owner Type
Purchase Details
Closed on
Oct 16, 2018
Sold by
Langford Jonathan D and Langford Kimberly L
Bought by
Land Plan Corp
Current Estimated Value
Purchase Details
Closed on
Apr 17, 2013
Sold by
Una Casa Llc
Bought by
Langford Jantan D
Home Financials for this Owner
Home Financials are based on the most recent Mortgage that was taken out on this home.
Original Mortgage
$235,653
Interest Rate
3.5%
Mortgage Type
FHA
Purchase Details
Closed on
Sep 29, 2008
Sold by
Derose Gary L and Derose Susan C
Bought by
Una Casa Llc
Purchase Details
Closed on
Sep 6, 2001
Sold by
Brett R Stewart Family Protection Trust
Bought by
Derose Gary L and Derose Susan C
Home Financials for this Owner
Home Financials are based on the most recent Mortgage that was taken out on this home.
Original Mortgage
$140,000
Interest Rate
7.05%
Create a Home Valuation Report for This Property
The Home Valuation Report is an in-depth analysis detailing your home's value as well as a comparison with similar homes in the area
Home Values in the Area
Average Home Value in this Area
Purchase History
| Date | Buyer | Sale Price | Title Company |
|---|---|---|---|
| Land Plan Corp | -- | Cottonwood Title | |
| Langford Jantan D | -- | Monument Title Ins Co | |
| Una Casa Llc | -- | Accommodation | |
| Derose Gary L | -- | Backman Stewart Title Servic |
Source: Public Records
Mortgage History
| Date | Status | Borrower | Loan Amount |
|---|---|---|---|
| Previous Owner | Lagrod Jonathan D | $30,000 | |
| Previous Owner | Langford Jantan D | $235,653 | |
| Previous Owner | Derose Gary L | $140,000 |
Source: Public Records
Tax History Compared to Growth
Tax History
| Year | Tax Paid | Tax Assessment Tax Assessment Total Assessment is a certain percentage of the fair market value that is determined by local assessors to be the total taxable value of land and additions on the property. | Land | Improvement |
|---|---|---|---|---|
| 2023 | $3,443 | $561,800 | $200,100 | $361,700 |
| 2022 | $3,670 | $587,400 | $219,200 | $368,200 |
| 2021 | $3,094 | $441,000 | $132,800 | $308,200 |
| 2020 | $2,626 | $348,900 | $132,800 | $216,100 |
| 2019 | $2,632 | $343,800 | $125,200 | $218,600 |
| 2018 | $0 | $317,500 | $125,200 | $192,300 |
| 2017 | $2,347 | $294,200 | $125,200 | $169,000 |
| 2016 | $2,300 | $276,600 | $125,200 | $151,400 |
| 2015 | $2,027 | $236,300 | $127,600 | $108,700 |
| 2014 | $1,942 | $222,000 | $121,600 | $100,400 |
Source: Public Records
Map
Nearby Homes
- 2028 W 12820 S
- 1838 W 13070 S
- 12875 S Aspen Glen Cir
- 12734 S 1630 W
- 1601 W 12800 S
- 12867 S 2200 W
- 2162 W Kimber Ln
- 1722 W Shade Ln
- 12418 S Redwood Rd
- 2332 W 13145 S
- 12978 S 2420 W
- 1056 W Kate Springs Ln S Unit 10
- 13105 S 2420 W
- 1915 W 13400 S
- 16158 S Railcar Ln Unit 1031
- 12647 S 2525 W
- 2401 W Adelaide Dr
- 12736 S Mccartney Way Unit 104
- 13053 S 1300 W
- 1263 W Moon Way Unit 132
- 12874 S 1830 W
- 12872 S 1830 W
- 12879 S Sabrina Row
- 12887 S Sabrina Row Unit 31
- 12910 S 1830 W
- 12862 S 1830 W
- 12895 S 1830 W
- 12852 S 1830 W
- 12908 S Sabrina Row
- 12854 S 1830 W
- 1762 W 12910 S
- 12842 S 1830 W
- 12913 S 1830 W
- 12934 S 1830 W
- 12924 S 1830 W
- 1881 Rips Ct
- 1869 Rips Ct
- 1881 W Rip's Ct Unit 9
- 1869 W Rip's Ct Unit 8
- 12832 S 1830 W