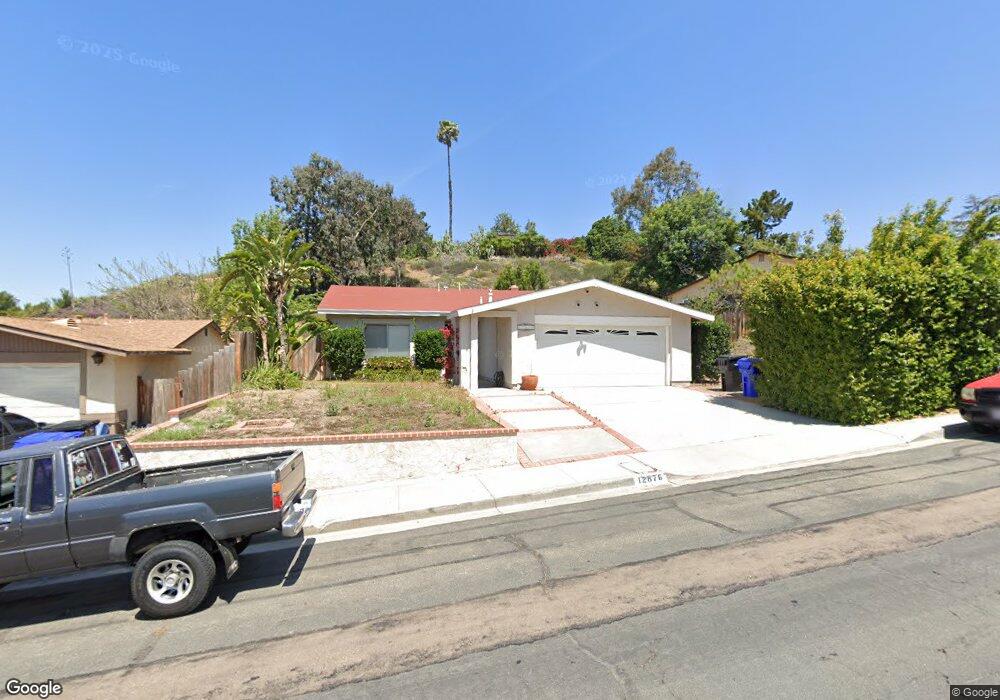
12876 Calle de Las Rosas San Diego, CA 92129
Rancho Peñasquitos NeighborhoodEstimated Value: $1,150,004 - $1,339,000
4
Beds
2
Baths
1,379
Sq Ft
$896/Sq Ft
Est. Value
About This Home
This home is located at 12876 Calle de Las Rosas, San Diego, CA 92129 and is currently estimated at $1,236,001, approximately $896 per square foot. 12876 Calle de Las Rosas is a home located in San Diego County with nearby schools including Canyon View Elementary School, Mesa Verde Middle School, and Westview High School.
Ownership History
Date
Name
Owned For
Owner Type
Purchase Details
Closed on
Mar 21, 2007
Sold by
Paik Andrea K and Matsuyama Ken T
Bought by
Matsuyama Ken T
Current Estimated Value
Home Financials for this Owner
Home Financials are based on the most recent Mortgage that was taken out on this home.
Original Mortgage
$390,000
Outstanding Balance
$236,449
Interest Rate
6.29%
Mortgage Type
New Conventional
Estimated Equity
$999,552
Purchase Details
Closed on
May 18, 2001
Sold by
Franke Christopher and Franke Corina
Bought by
Paik Andrea K and Matsuyama Ken T
Home Financials for this Owner
Home Financials are based on the most recent Mortgage that was taken out on this home.
Original Mortgage
$274,500
Interest Rate
7.15%
Purchase Details
Closed on
Jul 8, 1999
Sold by
Peterson Glennis R
Bought by
Franke Christopher and Trujillo Corina
Home Financials for this Owner
Home Financials are based on the most recent Mortgage that was taken out on this home.
Original Mortgage
$215,100
Interest Rate
7.64%
Mortgage Type
Balloon
Purchase Details
Closed on
Jun 18, 1987
Create a Home Valuation Report for This Property
The Home Valuation Report is an in-depth analysis detailing your home's value as well as a comparison with similar homes in the area
Home Values in the Area
Average Home Value in this Area
Purchase History
| Date | Buyer | Sale Price | Title Company |
|---|---|---|---|
| Matsuyama Ken T | -- | Commonwealth Land Title Co | |
| Paik Andrea K | $305,000 | Chicago Title Co | |
| Franke Christopher | $239,000 | Southland Title Company | |
| -- | $120,000 | -- |
Source: Public Records
Mortgage History
| Date | Status | Borrower | Loan Amount |
|---|---|---|---|
| Open | Matsuyama Ken T | $390,000 | |
| Previous Owner | Paik Andrea K | $274,500 | |
| Previous Owner | Franke Christopher | $215,100 |
Source: Public Records
Tax History Compared to Growth
Tax History
| Year | Tax Paid | Tax Assessment Tax Assessment Total Assessment is a certain percentage of the fair market value that is determined by local assessors to be the total taxable value of land and additions on the property. | Land | Improvement |
|---|---|---|---|---|
| 2025 | $5,867 | $533,417 | $295,408 | $238,009 |
| 2024 | $5,867 | $522,959 | $289,616 | $233,343 |
| 2023 | $5,740 | $512,706 | $283,938 | $228,768 |
| 2022 | $5,642 | $502,654 | $278,371 | $224,283 |
| 2021 | $5,566 | $492,799 | $272,913 | $219,886 |
| 2020 | $5,490 | $487,747 | $270,115 | $217,632 |
| 2019 | $5,346 | $478,184 | $264,819 | $213,365 |
| 2018 | $5,194 | $468,809 | $259,627 | $209,182 |
| 2017 | $5,053 | $459,618 | $254,537 | $205,081 |
| 2016 | $4,948 | $450,607 | $249,547 | $201,060 |
| 2015 | $4,873 | $443,839 | $245,799 | $198,040 |
| 2014 | $4,757 | $435,146 | $240,985 | $194,161 |
Source: Public Records
Map
Nearby Homes
- 12940 Calle de Las Rosas
- 12979 Calle de Las Rosas
- 13113 Calle de Las Rosas
- 12727 Calle de Las Rosas
- 9959 Azuaga St Unit 105
- 9720 Graceland Way
- 10202 Vista Lusardi Unit 9
- 10202 Vista Lusardi Unit LOT 9
- Plan 1 at Paseo Sereno
- Plan 2 at Paseo Sereno
- Plan 3 at Paseo Sereno
- 9562 Benavente St
- 12811 Encantadora Unit 32
- 9525 High Park Ln
- 9525 Vervain St
- 13292 Salmon River Rd Unit 204
- 13202 Salmon River Rd Unit 101
- 10131 Freeport Ct
- 10740 Sabre Hill Dr Unit 120
- 10824 Sabre Hill Dr Unit 194
- 12866 Calle de Las Rosas
- 12886 Calle de Las Rosas
- 12896 Calle de Las Rosas
- 12856 Calle de Las Rosas
- 12910 Calle de Las Rosas
- 12909 Via Del Valedor
- 12846 Calle de Las Rosas
- 12883 Calle de Las Rosas
- 12919 Via Del Valedor
- 12889 Calle de Las Rosas
- 12836 Calle de Las Rosas
- 12867 Calle de Las Rosas
- 12875 Calle de Las Rosas
- 12859 Calle de Las Rosas
- 12895 Calle de Las Rosas
- 12929 Via Del Valedor
- 12851 Calle de Las Rosas
- 12910 Via Del Valedor
- 12909 Calle de Las Rosas
- 12930 Calle de Las Rosas