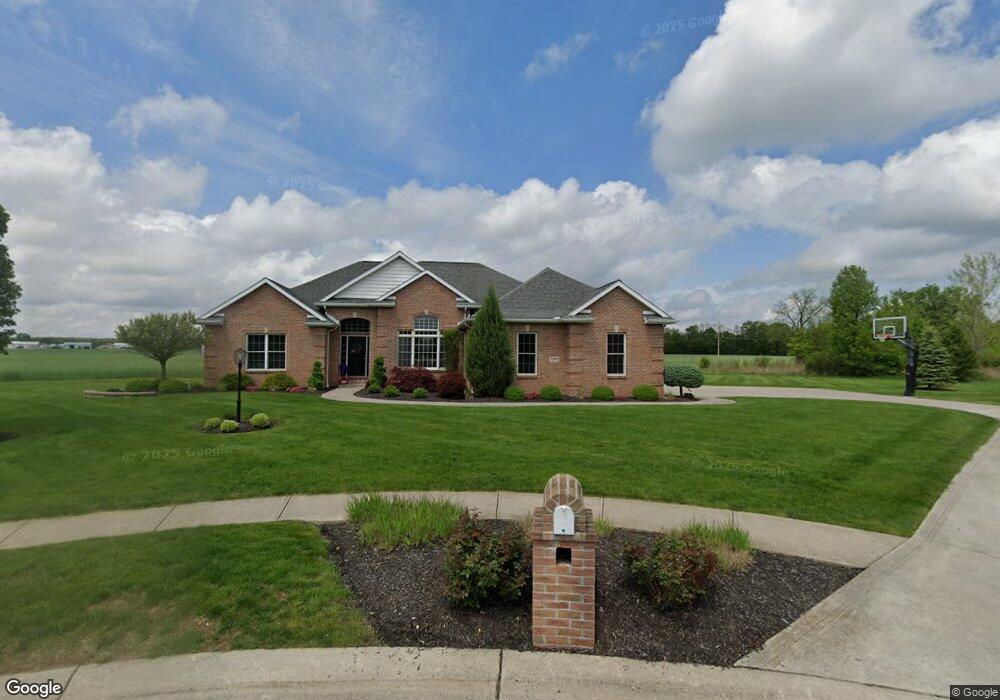
1288 Bearpaw Dr Defiance, OH 43512
Estimated Value: $309,000 - $512,000
4
Beds
3
Baths
2,375
Sq Ft
$171/Sq Ft
Est. Value
About This Home
This home is located at 1288 Bearpaw Dr, Defiance, OH 43512 and is currently estimated at $405,159, approximately $170 per square foot. 1288 Bearpaw Dr is a home located in Defiance County with nearby schools including Noble Elementary School, Tinora Elementary School, and Tinora Middle School.
Ownership History
Date
Name
Owned For
Owner Type
Purchase Details
Closed on
Sep 20, 2019
Sold by
Starner Jeffrey R and Starner Amanda A
Bought by
Starner Amanda A
Current Estimated Value
Purchase Details
Closed on
Dec 30, 2010
Sold by
North West Ohio Development Company Llc
Bought by
Starner Jeffrey R and Starner Amanda A
Home Financials for this Owner
Home Financials are based on the most recent Mortgage that was taken out on this home.
Original Mortgage
$232,000
Outstanding Balance
$155,577
Interest Rate
4.44%
Mortgage Type
New Conventional
Estimated Equity
$249,582
Purchase Details
Closed on
Oct 6, 2010
Sold by
Yoder Randy J
Bought by
North West Ohio Development Co Llc
Home Financials for this Owner
Home Financials are based on the most recent Mortgage that was taken out on this home.
Original Mortgage
$225,000
Interest Rate
4.3%
Mortgage Type
Unknown
Purchase Details
Closed on
Oct 21, 2003
Bought by
Starner Jeffrey R and Starner Amanda A
Create a Home Valuation Report for This Property
The Home Valuation Report is an in-depth analysis detailing your home's value as well as a comparison with similar homes in the area
Home Values in the Area
Average Home Value in this Area
Purchase History
| Date | Buyer | Sale Price | Title Company |
|---|---|---|---|
| Starner Amanda A | -- | None Available | |
| Starner Jeffrey R | $290,000 | -- | |
| North West Ohio Development Co Llc | $310,000 | -- | |
| Starner Jeffrey R | $29,000 | -- |
Source: Public Records
Mortgage History
| Date | Status | Borrower | Loan Amount |
|---|---|---|---|
| Open | Starner Jeffrey R | $232,000 | |
| Previous Owner | North West Ohio Development Co Llc | $225,000 |
Source: Public Records
Tax History Compared to Growth
Tax History
| Year | Tax Paid | Tax Assessment Tax Assessment Total Assessment is a certain percentage of the fair market value that is determined by local assessors to be the total taxable value of land and additions on the property. | Land | Improvement |
|---|---|---|---|---|
| 2024 | $4,364 | $125,350 | $11,280 | $114,070 |
| 2023 | $4,364 | $125,350 | $11,280 | $114,070 |
| 2022 | $4,471 | $108,290 | $11,280 | $97,010 |
| 2021 | $4,471 | $108,290 | $11,280 | $97,010 |
| 2020 | $4,456 | $108,290 | $11,280 | $97,010 |
| 2019 | $4,175 | $103,890 | $11,270 | $92,620 |
| 2018 | $4,296 | $103,890 | $11,270 | $92,620 |
| 2017 | $3,830 | $103,887 | $11,266 | $92,621 |
| 2016 | $3,394 | $90,304 | $10,248 | $80,056 |
| 2015 | $1,774 | $90,304 | $10,248 | $80,056 |
| 2014 | $1,774 | $90,304 | $10,248 | $80,056 |
| 2013 | $1,774 | $90,304 | $10,248 | $80,056 |
| 2012 | $1,774 | $90,304 | $10,248 | $80,056 |
Source: Public Records
Map
Nearby Homes
- 1476 Mustang Dr
- 2169 Hawthorne Dr
- 4120 Misty Shores Rd
- 22140 Switzer Rd
- 383 Maumee River Crossing
- 518 Fugate Dr
- 0 Maumee River Crossing
- 0 Rose St Unit Lot L 6004739
- 321 Harding St
- 202 Wilson St
- 20975 Buckskin Rd
- 00 Widmer St
- 622 Nicholas St
- 205 Stadium Dr
- 336 Holgate Ave
- 1003 Davidson St
- 250 Gray St
- 726 Indian Bridge Ln
- 0 Baltimore St
- 724 Thurston St
- 1282 Bearpaw Dr
- 1276 Bearpaw Dr
- 1289 Bearpaw Dr
- 1283 Bearpaw Dr
- 1270 Bearpaw Dr
- 1275 Bearpaw Dr
- 1462 Riverbend Dr
- 1269 Bearpaw Dr
- 1264 Bearpaw Dr
- 1464 Riverbend Dr
- 1263 Bearpaw Dr
- 1258 Bearpaw Dr
- 1460 Riverbend Dr
- 1257 Bearpaw Dr
- 1252 Bearpaw Dr
- 1463 Riverbend Dr
- 1458 Riverbend Dr
- 1253 Bearpaw Dr
- 1246 Bearpaw Dr
- 1461 Riverbend Dr