129 29th St Msc, UT 84401
TO Smith NeighborhoodEstimated Value: $110,000 - $385,000
Studio
--
Bath
--
Sq Ft
8,276
Sq Ft Lot
About This Home
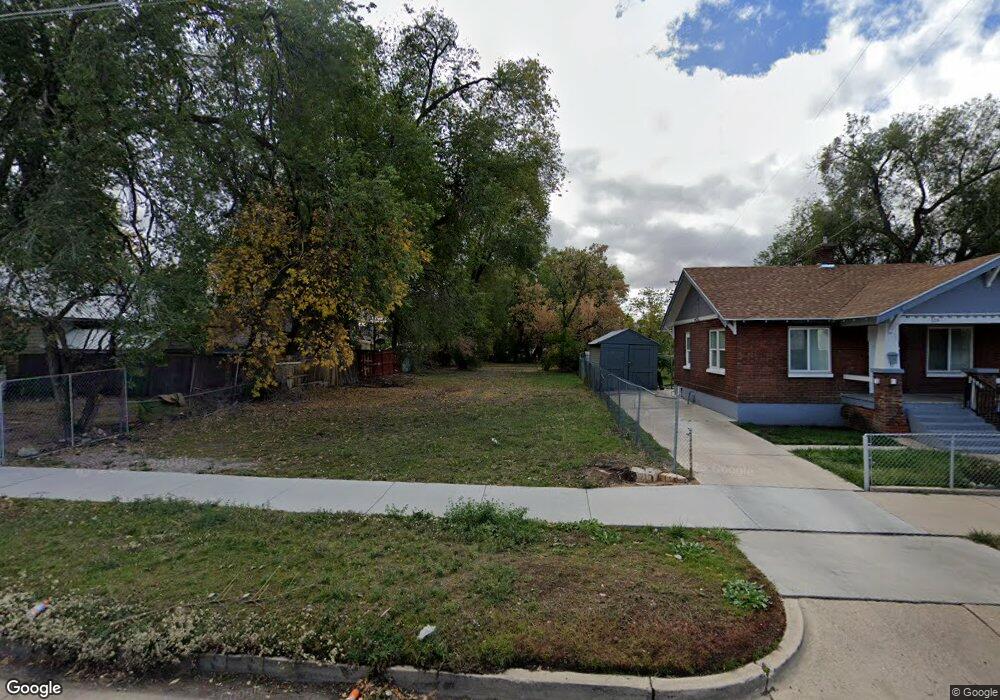
This home is located at 129 29th St, Msc, UT 84401 and is currently estimated at $187,421. 129 29th St is a home located in Weber County with nearby schools including Mount Ogden Junior High School, Ogden High School, and St Joseph Catholic School.
Ownership History
Date
Name
Owned For
Owner Type
Purchase Details
Closed on
Oct 30, 1998
Sold by
Greenwood Barnard H
Bought by
Weaver Kevin
Current Estimated Value
Home Financials for this Owner
Home Financials are based on the most recent Mortgage that was taken out on this home.
Original Mortgage
$4,000
Outstanding Balance
$892
Interest Rate
6.84%
Mortgage Type
Seller Take Back
Estimated Equity
$186,529
Create a Home Valuation Report for This Property
The Home Valuation Report is an in-depth analysis detailing your home's value as well as a comparison with similar homes in the area
Home Values in the Area
Average Home Value in this Area
Purchase History
| Date | Buyer | Sale Price | Title Company |
|---|---|---|---|
| Weaver Kevin | -- | Mountain View Title | |
| Weaver Kevin | -- | Mountain View Title | |
| Weaver Kevin | -- | Mountain View Title | |
| Weaver Kevin | -- | Mountain View Title |
Source: Public Records
Mortgage History
| Date | Status | Borrower | Loan Amount |
|---|---|---|---|
| Open | Weaver Kevin | $4,000 |
Source: Public Records
Tax History
| Year | Tax Paid | Tax Assessment Tax Assessment Total Assessment is a certain percentage of the fair market value that is determined by local assessors to be the total taxable value of land and additions on the property. | Land | Improvement |
|---|---|---|---|---|
| 2025 | $860 | $69,350 | $69,350 | $0 |
| 2024 | $868 | $68,710 | $68,710 | $0 |
| 2023 | $339 | $27,000 | $27,000 | $0 |
| 2022 | $282 | $22,500 | $22,500 | $0 |
| 2021 | $228 | $16,650 | $16,650 | $0 |
| 2020 | $67 | $4,500 | $4,500 | $0 |
| 2019 | $71 | $4,500 | $4,500 | $0 |
| 2018 | $72 | $4,500 | $4,500 | $0 |
| 2017 | $77 | $4,500 | $4,500 | $0 |
| 2016 | $78 | $4,500 | $4,500 | $0 |
| 2015 | $80 | $4,500 | $4,500 | $0 |
| 2014 | $81 | $4,500 | $4,500 | $0 |
Source: Public Records
Map
Nearby Homes
Your Personal Tour Guide
Ask me questions while you tour the home.