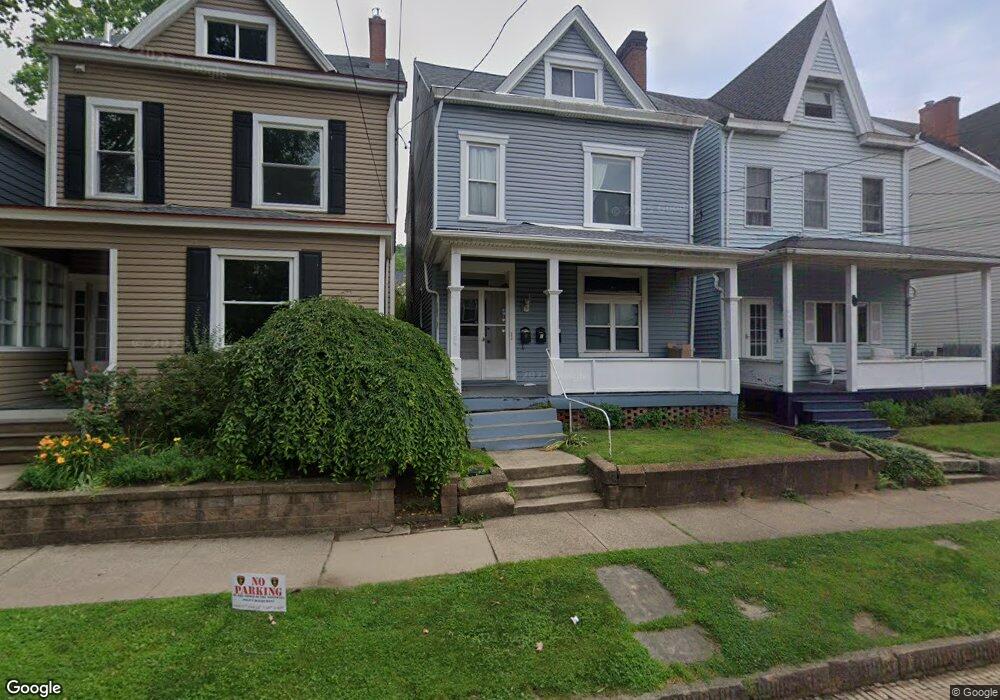
129 3rd St Aspinwall, PA 15215
Estimated Value: $283,000 - $319,000
6
Beds
3
Baths
2,151
Sq Ft
$140/Sq Ft
Est. Value
About This Home
This home is located at 129 3rd St, Aspinwall, PA 15215 and is currently estimated at $301,000, approximately $139 per square foot. 129 3rd St is a home located in Allegheny County with nearby schools including Fox Chapel Area High School, Catalyst Academy Charter School, and Christ The Divine Teacher Catholic Academy.
Ownership History
Date
Name
Owned For
Owner Type
Purchase Details
Closed on
Sep 4, 2014
Sold by
Linzoain Pablo M and Simpson David A
Bought by
Linzoain Pablo M
Current Estimated Value
Purchase Details
Closed on
Sep 1, 2010
Sold by
Reckless Dale Steven and Reckless Tracy W
Bought by
Linzoain Pablo M and Simpson David A
Home Financials for this Owner
Home Financials are based on the most recent Mortgage that was taken out on this home.
Original Mortgage
$105,700
Interest Rate
4.51%
Mortgage Type
New Conventional
Purchase Details
Closed on
May 11, 1999
Sold by
Fields James M and Hanratty Elizabeth
Bought by
Reckless Dale Steven
Purchase Details
Closed on
Jan 1, 1900
Create a Home Valuation Report for This Property
The Home Valuation Report is an in-depth analysis detailing your home's value as well as a comparison with similar homes in the area
Home Values in the Area
Average Home Value in this Area
Purchase History
| Date | Buyer | Sale Price | Title Company |
|---|---|---|---|
| Linzoain Pablo M | $87,780 | -- | |
| Linzoain Pablo M | $151,000 | -- | |
| Reckless Dale Steven | $87,000 | -- | |
| -- | -- | -- |
Source: Public Records
Mortgage History
| Date | Status | Borrower | Loan Amount |
|---|---|---|---|
| Previous Owner | Linzoain Pablo M | $105,700 |
Source: Public Records
Tax History
| Year | Tax Paid | Tax Assessment Tax Assessment Total Assessment is a certain percentage of the fair market value that is determined by local assessors to be the total taxable value of land and additions on the property. | Land | Improvement |
|---|---|---|---|---|
| 2025 | $1,026 | $159,600 | $75,000 | $84,600 |
| 2024 | $5,399 | $159,600 | $75,000 | $84,600 |
| 2023 | $5,110 | $159,600 | $75,000 | $84,600 |
| 2022 | $5,062 | $159,600 | $75,000 | $84,600 |
| 2021 | $755 | $159,600 | $75,000 | $84,600 |
| 2020 | $4,974 | $159,600 | $75,000 | $84,600 |
| 2019 | $4,974 | $159,600 | $75,000 | $84,600 |
| 2018 | $4,777 | $159,600 | $75,000 | $84,600 |
| 2017 | $4,720 | $159,600 | $75,000 | $84,600 |
| 2016 | $755 | $159,600 | $75,000 | $84,600 |
| 2015 | $755 | $159,600 | $75,000 | $84,600 |
| 2014 | $4,504 | $159,600 | $75,000 | $84,600 |
Source: Public Records
Map
Nearby Homes
- 413 Center Ave
- 115 5th St
- 33 5th St
- 24 5th St
- 309 Highland Terrace
- 218 10th St
- 104 Brilliant Ave
- 700 4th St Unit 6
- 607 W Waldheim Rd
- 202 West Dr
- 122 22nd St
- 101 Buckingham Rd
- 918 W Waldheim Rd
- 2010 Noble St
- 1920 Middle St
- 700 W Waldheim Rd
- 116 Westchester Place
- 203 Grandview Dr N
- 1850 Middle St
- 1812 Cecil St
Your Personal Tour Guide
Ask me questions while you tour the home.