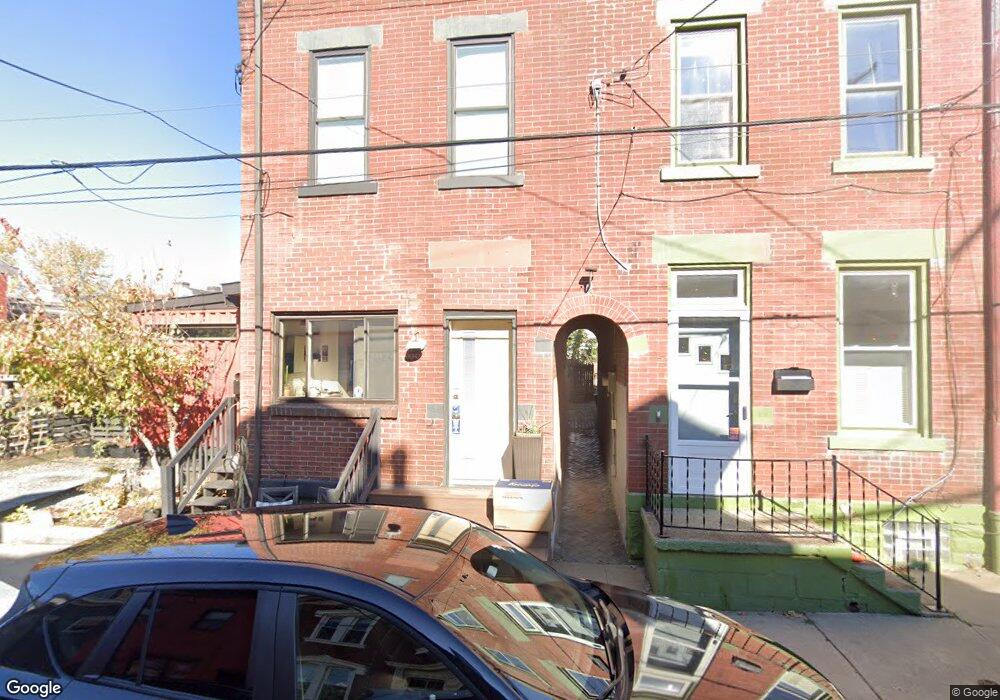
129 41st St Pittsburgh, PA 15201
Central Lawrenceville NeighborhoodEstimated Value: $326,610 - $524,000
2
Beds
1
Bath
1,920
Sq Ft
$213/Sq Ft
Est. Value
About This Home
This home is located at 129 41st St, Pittsburgh, PA 15201 and is currently estimated at $409,653, approximately $213 per square foot. 129 41st St is a home located in Allegheny County with nearby schools including Pittsburgh Arsenal 6-8, Pittsburgh Arsenal K-5, and Pittsburgh Milliones 6-12.
Ownership History
Date
Name
Owned For
Owner Type
Purchase Details
Closed on
Jul 27, 2009
Sold by
Turkowski Jeffrey E
Bought by
Yaron Dror Y
Current Estimated Value
Purchase Details
Closed on
Nov 15, 2007
Sold by
Rosenfeld Norman
Bought by
Yaron Dror Y
Home Financials for this Owner
Home Financials are based on the most recent Mortgage that was taken out on this home.
Original Mortgage
$48,000
Interest Rate
6.41%
Mortgage Type
New Conventional
Purchase Details
Closed on
Nov 30, 1998
Sold by
Blair Irene T and Bierce Regina A
Bought by
Rosenfeld Norman and Rosenfeld Rhoda
Purchase Details
Closed on
Jan 1, 1900
Create a Home Valuation Report for This Property
The Home Valuation Report is an in-depth analysis detailing your home's value as well as a comparison with similar homes in the area
Home Values in the Area
Average Home Value in this Area
Purchase History
| Date | Buyer | Sale Price | Title Company |
|---|---|---|---|
| Yaron Dror Y | $13,500 | -- | |
| Yaron Dror Y | $60,000 | -- | |
| Rosenfeld Norman | $22,000 | -- | |
| -- | -- | -- |
Source: Public Records
Mortgage History
| Date | Status | Borrower | Loan Amount |
|---|---|---|---|
| Previous Owner | Yaron Dror Y | $48,000 |
Source: Public Records
Tax History Compared to Growth
Tax History
| Year | Tax Paid | Tax Assessment Tax Assessment Total Assessment is a certain percentage of the fair market value that is determined by local assessors to be the total taxable value of land and additions on the property. | Land | Improvement |
|---|---|---|---|---|
| 2025 | $1,735 | $75,300 | $20,000 | $55,300 |
| 2024 | $1,735 | $75,300 | $20,000 | $55,300 |
| 2023 | $1,735 | $75,300 | $20,000 | $55,300 |
| 2022 | $1,712 | $75,300 | $20,000 | $55,300 |
| 2021 | $1,712 | $75,300 | $20,000 | $55,300 |
| 2020 | $1,704 | $75,300 | $20,000 | $55,300 |
| 2019 | $1,704 | $75,300 | $20,000 | $55,300 |
| 2018 | $1,274 | $75,300 | $20,000 | $55,300 |
| 2017 | $1,704 | $75,300 | $20,000 | $55,300 |
| 2016 | $356 | $75,300 | $20,000 | $55,300 |
| 2015 | $356 | $75,300 | $20,000 | $55,300 |
| 2014 | $1,666 | $92,700 | $20,000 | $72,700 |
Source: Public Records
Map
Nearby Homes