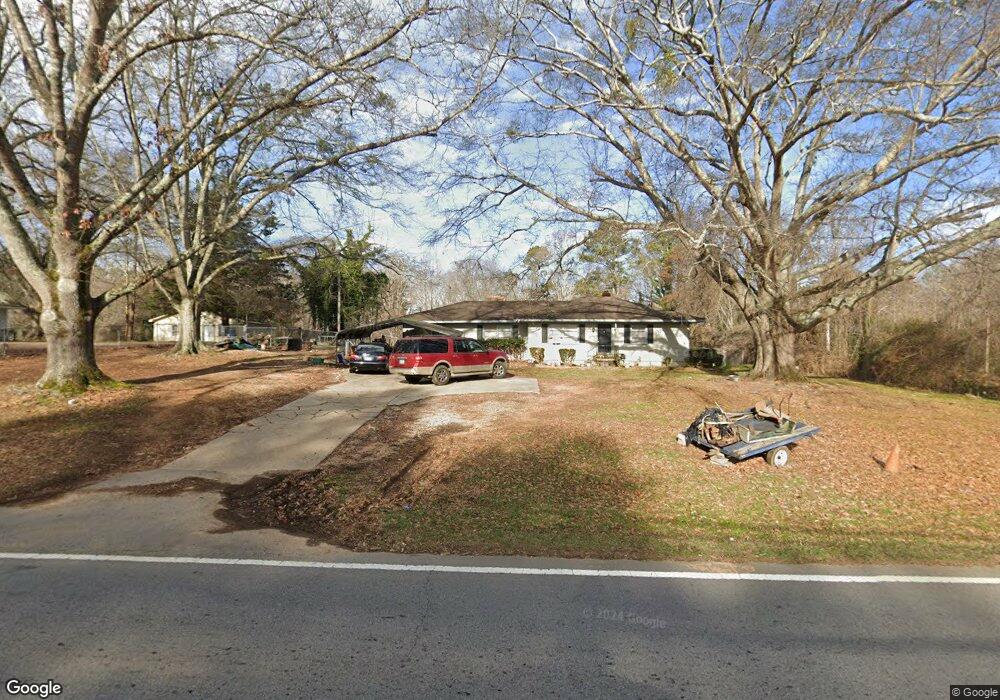
129 Clarks Bridge Rd Gainesville, GA 30501
Estimated Value: $157,000 - $327,000
2
Beds
1
Bath
1,572
Sq Ft
$149/Sq Ft
Est. Value
About This Home
This home is located at 129 Clarks Bridge Rd, Gainesville, GA 30501 and is currently estimated at $233,981, approximately $148 per square foot. 129 Clarks Bridge Rd is a home located in Hall County with nearby schools including Riverbend Elementary School, North Hall Middle School, and North Hall High School.
Ownership History
Date
Name
Owned For
Owner Type
Purchase Details
Closed on
Apr 30, 2014
Sold by
Abbeylara 1 Llc
Bought by
Pdfenlon Llc
Current Estimated Value
Purchase Details
Closed on
Apr 22, 2010
Sold by
Horan Patrick
Bought by
Abbeylara 1 Llc
Purchase Details
Closed on
Nov 19, 2009
Sold by
Federal Natl Mtg Assn Fnma
Bought by
Horan Patrick
Purchase Details
Closed on
Feb 3, 2009
Sold by
Chase Home Finance Llc
Bought by
Federal National Mortgage Association
Purchase Details
Closed on
Jun 6, 2007
Sold by
Wofford John Clayton
Bought by
Wofford Betty W
Purchase Details
Closed on
Sep 26, 2002
Sold by
Harwell Robert C and Harwell Dortha M
Bought by
Gillum Kyle and Wanda Gail
Home Financials for this Owner
Home Financials are based on the most recent Mortgage that was taken out on this home.
Original Mortgage
$102,192
Interest Rate
6.19%
Mortgage Type
FHA
Create a Home Valuation Report for This Property
The Home Valuation Report is an in-depth analysis detailing your home's value as well as a comparison with similar homes in the area
Home Values in the Area
Average Home Value in this Area
Purchase History
| Date | Buyer | Sale Price | Title Company |
|---|---|---|---|
| Pdfenlon Llc | -- | -- | |
| Abbeylara 1 Llc | -- | -- | |
| Horan Patrick | -- | -- | |
| Federal National Mortgage Association | -- | -- | |
| Chase Home Finance Llc | $115,080 | -- | |
| Chase Home Finance Llc | $115,100 | -- | |
| Wofford Betty W | -- | -- | |
| Gillum Kyle | $103,000 | -- |
Source: Public Records
Mortgage History
| Date | Status | Borrower | Loan Amount |
|---|---|---|---|
| Previous Owner | Gillum Kyle | $102,192 |
Source: Public Records
Tax History Compared to Growth
Tax History
| Year | Tax Paid | Tax Assessment Tax Assessment Total Assessment is a certain percentage of the fair market value that is determined by local assessors to be the total taxable value of land and additions on the property. | Land | Improvement |
|---|---|---|---|---|
| 2024 | $1,579 | $60,960 | $21,560 | $39,400 |
| 2023 | $1,318 | $50,400 | $15,880 | $34,520 |
| 2022 | $1,456 | $53,680 | $23,960 | $29,720 |
| 2021 | $974 | $34,280 | $6,600 | $27,680 |
| 2020 | $960 | $32,800 | $6,600 | $26,200 |
| 2019 | $911 | $30,680 | $6,600 | $24,080 |
| 2018 | $860 | $27,880 | $6,600 | $21,280 |
| 2017 | $801 | $26,080 | $6,600 | $19,480 |
| 2016 | $783 | $26,080 | $6,600 | $19,480 |
| 2015 | $623 | $26,080 | $6,600 | $19,480 |
| 2014 | $623 | $29,000 | $6,600 | $22,400 |
Source: Public Records
Map
Nearby Homes
- 102 Wildwood Cir
- 1930 Tapawingo Dr
- 1672 Meadow Lark Ln
- 1291 Russell Rd
- 3 & 5 Indianola Dr
- 2069 Riverwood Dr
- 3734 Shades Valley Ln
- 1540 Walter Stover Rd
- 2728 Limestone Creek Dr
- 4701A Cleveland Hwy
- 4701A Cleveland Hwy Unit A
- 1820 Kettle Crossing
- 1824 Kettle Crossing
- 1996 Briarwood Dr
- 1531 Enota Ave NE
- 3000 Clarks Bridge Rd
- 3439 Clarks Bridge Rd
- 127 Clarks Bridge Rd
- 131 Clarks Bridge Rd
- 125 Clarks Bridge Rd
- 130 Clarks Bridge Rd
- 118 Evergreen Trail
- 126 Clarks Bridge Rd
- 123 Clarks Bridge Rd
- 116 Wildwood Cir
- 116 Evergreen Trail
- 1025 Morningside Cir
- 114 Wildwood Cir
- 118 Wildwood Cir
- 133 Clarks Bridge Rd
- 121 Clarks Bridge Rd
- 112 Wildwood Cir
- 1001 Pine Valley Rd
- 115 Wildwood Cir
- 103 Evergreen Trail
- 108 Wildwood Cir
- 0 Morningside Cir