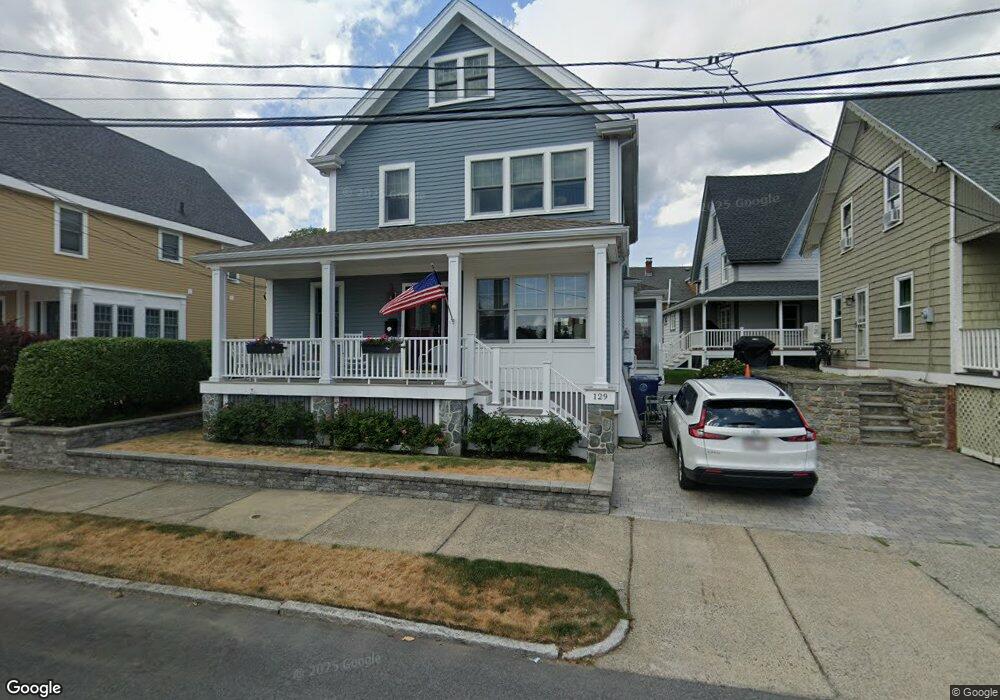
129 Columbus Ave Salem, MA 01970
Salem Willows NeighborhoodEstimated Value: $711,000 - $1,057,000
3
Beds
3
Baths
1,469
Sq Ft
$591/Sq Ft
Est. Value
About This Home
This home is located at 129 Columbus Ave, Salem, MA 01970 and is currently estimated at $867,864, approximately $590 per square foot. 129 Columbus Ave is a home located in Essex County with nearby schools including Carlton Elementary School, Saltonstall School, and Bates Elementary School.
Ownership History
Date
Name
Owned For
Owner Type
Purchase Details
Closed on
Dec 13, 2013
Sold by
Campbell Karen
Bought by
Callahan Lawrence L and Callahan Deborah E
Current Estimated Value
Home Financials for this Owner
Home Financials are based on the most recent Mortgage that was taken out on this home.
Original Mortgage
$240,000
Outstanding Balance
$182,037
Interest Rate
4.14%
Mortgage Type
New Conventional
Estimated Equity
$685,827
Create a Home Valuation Report for This Property
The Home Valuation Report is an in-depth analysis detailing your home's value as well as a comparison with similar homes in the area
Home Values in the Area
Average Home Value in this Area
Purchase History
| Date | Buyer | Sale Price | Title Company |
|---|---|---|---|
| Callahan Lawrence L | $300,000 | -- |
Source: Public Records
Mortgage History
| Date | Status | Borrower | Loan Amount |
|---|---|---|---|
| Open | Callahan Lawrence L | $240,000 |
Source: Public Records
Tax History
| Year | Tax Paid | Tax Assessment Tax Assessment Total Assessment is a certain percentage of the fair market value that is determined by local assessors to be the total taxable value of land and additions on the property. | Land | Improvement |
|---|---|---|---|---|
| 2025 | $7,935 | $699,700 | $245,600 | $454,100 |
| 2024 | $7,709 | $663,400 | $234,200 | $429,200 |
| 2023 | $7,503 | $599,800 | $217,100 | $382,700 |
| 2022 | $7,126 | $537,800 | $205,600 | $332,200 |
| 2021 | $7,153 | $518,300 | $199,900 | $318,400 |
| 2020 | $6,953 | $481,200 | $199,900 | $281,300 |
| 2019 | $6,718 | $444,900 | $199,900 | $245,000 |
| 2018 | $6,546 | $425,600 | $191,400 | $234,200 |
| 2017 | $6,238 | $393,300 | $171,400 | $221,900 |
| 2016 | $5,939 | $379,000 | $157,100 | $221,900 |
| 2015 | $4,892 | $298,100 | $157,100 | $141,000 |
Source: Public Records
Map
Nearby Homes
- 5 Winter Island Rd
- 4 Winter Island Rd
- 7 Larkin Ln
- 23 1/2 Lovett St
- 24 Franklin Place
- 3 Elm Top Ln
- 8 Webb St
- 17 Webb St Unit 1
- 13 Fayette St Unit 3
- 12 Summit Ave Unit 4
- 16 School St Unit 3
- 40 Railroad Ave Unit B2
- 50 Rantoul St Unit 509S
- 60 Rantoul St Unit 604N
- 60 Rantoul St Unit 114N
- 21 Emerton St Unit 2
- 11 Barton St
- 4 Broadmere Way
- 40 Essex St Unit 2
- 1 Boardman St Unit 6
Your Personal Tour Guide
Ask me questions while you tour the home.