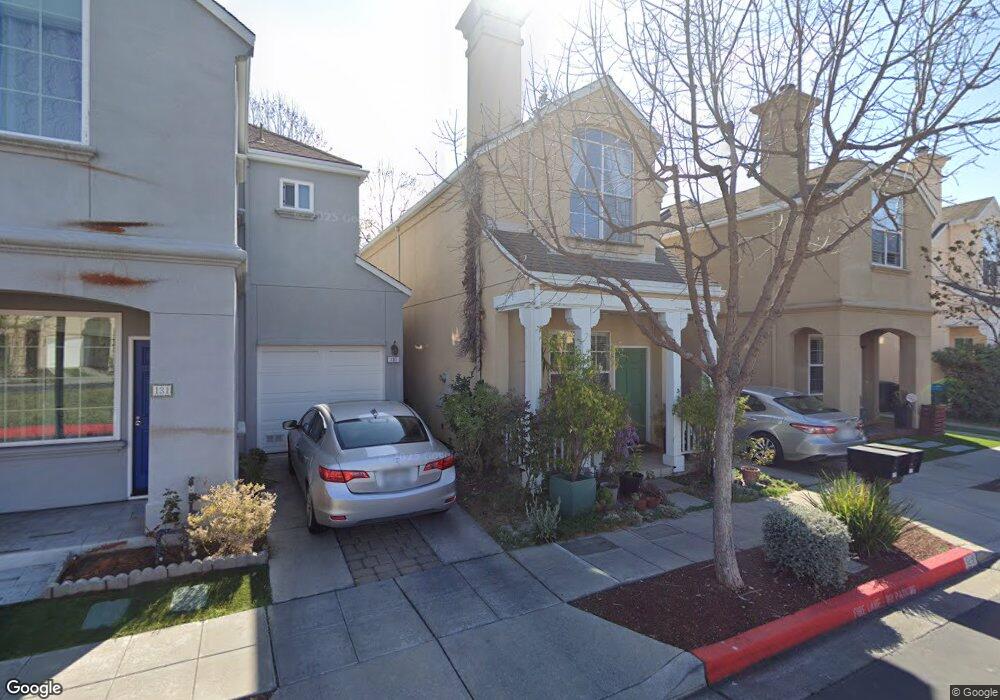
129 Concord Cir Mountain View, CA 94040
Mountain View West NeighborhoodEstimated Value: $2,025,000 - $2,211,211
3
Beds
3
Baths
1,290
Sq Ft
$1,662/Sq Ft
Est. Value
About This Home
This home is located at 129 Concord Cir, Mountain View, CA 94040 and is currently estimated at $2,144,553, approximately $1,662 per square foot. 129 Concord Cir is a home located in Santa Clara County with nearby schools including Covington Elementary School, Ardis G. Egan Junior High School, and Los Altos High School.
Ownership History
Date
Name
Owned For
Owner Type
Purchase Details
Closed on
May 23, 2000
Sold by
Swan Adrienne L and Swan Adrienne L
Bought by
Friberg Stephen R and Friberg Sodeyo N
Current Estimated Value
Home Financials for this Owner
Home Financials are based on the most recent Mortgage that was taken out on this home.
Original Mortgage
$437,500
Outstanding Balance
$150,489
Interest Rate
8.08%
Mortgage Type
Stand Alone First
Estimated Equity
$1,994,064
Purchase Details
Closed on
Mar 2, 1995
Sold by
Swan Kenneth M
Bought by
Swan Adrienne L
Purchase Details
Closed on
Nov 29, 1994
Sold by
Plymouth Mountain View Centre Lp
Bought by
Swan Adrienne L
Home Financials for this Owner
Home Financials are based on the most recent Mortgage that was taken out on this home.
Original Mortgage
$200,000
Interest Rate
8%
Create a Home Valuation Report for This Property
The Home Valuation Report is an in-depth analysis detailing your home's value as well as a comparison with similar homes in the area
Home Values in the Area
Average Home Value in this Area
Purchase History
| Date | Buyer | Sale Price | Title Company |
|---|---|---|---|
| Friberg Stephen R | $626,000 | North American Title Co | |
| Swan Adrienne L | -- | Fidelity National Title Ins | |
| Swan Adrienne L | $277,500 | Fidelity National Title Ins |
Source: Public Records
Mortgage History
| Date | Status | Borrower | Loan Amount |
|---|---|---|---|
| Open | Friberg Stephen R | $437,500 | |
| Previous Owner | Swan Adrienne L | $200,000 |
Source: Public Records
Tax History
| Year | Tax Paid | Tax Assessment Tax Assessment Total Assessment is a certain percentage of the fair market value that is determined by local assessors to be the total taxable value of land and additions on the property. | Land | Improvement |
|---|---|---|---|---|
| 2025 | $10,747 | $962,905 | $461,081 | $501,824 |
| 2024 | $10,747 | $944,026 | $452,041 | $491,985 |
| 2023 | $10,747 | $925,517 | $443,178 | $482,339 |
| 2022 | $10,534 | $907,371 | $434,489 | $472,882 |
| 2021 | $10,591 | $889,580 | $425,970 | $463,610 |
| 2020 | $10,677 | $880,460 | $421,603 | $458,857 |
| 2019 | $10,962 | $863,197 | $413,337 | $449,860 |
| 2018 | $10,855 | $846,273 | $405,233 | $441,040 |
| 2017 | $10,458 | $829,681 | $397,288 | $432,393 |
| 2016 | $10,160 | $813,414 | $389,499 | $423,915 |
| 2015 | $10,014 | $801,197 | $383,649 | $417,548 |
| 2014 | $9,907 | $785,503 | $376,134 | $409,369 |
Source: Public Records
Map
Nearby Homes
- 131 Concord Cir
- 49 Showers Dr Unit A130
- 49 Showers Dr Unit N265
- 126 Pacchetti Way
- 2235 Mora Place
- 2272 Towne Cir
- 400 Ortega Ave Unit 216
- 400 Ortega Ave Unit 313
- 400 Ortega Ave Unit 301
- 70 Towne Cir
- 2375 Adele Ave
- 426 Hillwood Ct Unit 303
- 280 College Ave
- 2483 Whitney Dr
- 520 Shockley Aly
- 549 Shockley Aly
- 554 S Rengstorff Ave
- 556 S Rengstorff Ave
- 3003 Marcelli Cir
- 64 Los Altos Square
- 127 Concord Cir
- 133 Concord Cir
- 135 Concord Cir
- 123 Concord Cir
- 137 Concord Cir
- 139 Concord Cir
- 119 Concord Cir
- 117 Concord Cir
- 115 Concord Cir
- 141 Concord Cir
- 112 Concord Cir
- 110 Concord Cir
- 108 Concord Cir
- 113 Concord Cir
- 106 Concord Cir
- 143 Concord Cir
- 101 Laurel Way
- 104 Concord Cir
- 100 Laurel Way
- 102 Concord Cir
Your Personal Tour Guide
Ask me questions while you tour the home.