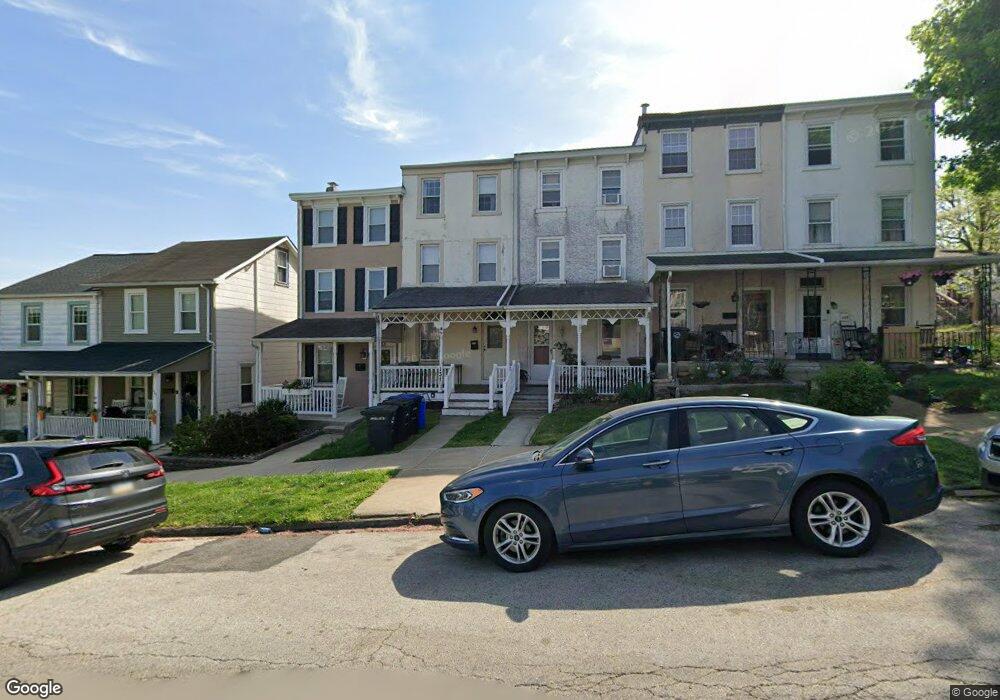
129 E 9th Ave Conshohocken, PA 19428
Estimated Value: $308,000 - $477,000
4
Beds
1
Bath
1,400
Sq Ft
$286/Sq Ft
Est. Value
About This Home
This home is located at 129 E 9th Ave, Conshohocken, PA 19428 and is currently estimated at $399,910, approximately $285 per square foot. 129 E 9th Ave is a home located in Montgomery County with nearby schools including Conshohocken Elementary School, Colonial Elementary School, and Colonial Middle School.
Ownership History
Date
Name
Owned For
Owner Type
Purchase Details
Closed on
Aug 30, 2006
Sold by
Casey Shannon and Casey Rebecca
Bought by
Jensen Hans H
Current Estimated Value
Home Financials for this Owner
Home Financials are based on the most recent Mortgage that was taken out on this home.
Original Mortgage
$43,000
Outstanding Balance
$25,879
Interest Rate
6.71%
Estimated Equity
$374,031
Purchase Details
Closed on
Apr 23, 2003
Sold by
Dangelo John and Ferry Dennis
Bought by
Casey Shannon T and Liberatoscioli Rebecca A
Create a Home Valuation Report for This Property
The Home Valuation Report is an in-depth analysis detailing your home's value as well as a comparison with similar homes in the area
Home Values in the Area
Average Home Value in this Area
Purchase History
| Date | Buyer | Sale Price | Title Company |
|---|---|---|---|
| Jensen Hans H | $215,000 | None Available | |
| Casey Shannon T | $157,000 | -- |
Source: Public Records
Mortgage History
| Date | Status | Borrower | Loan Amount |
|---|---|---|---|
| Open | Jensen Hans H | $43,000 | |
| Open | Jensen Hans H | $172,000 |
Source: Public Records
Tax History
| Year | Tax Paid | Tax Assessment Tax Assessment Total Assessment is a certain percentage of the fair market value that is determined by local assessors to be the total taxable value of land and additions on the property. | Land | Improvement |
|---|---|---|---|---|
| 2025 | $3,056 | $85,340 | $27,090 | $58,250 |
| 2024 | $2,961 | $85,340 | $27,090 | $58,250 |
| 2023 | $2,861 | $85,340 | $27,090 | $58,250 |
| 2022 | $2,800 | $85,340 | $27,090 | $58,250 |
| 2021 | $2,721 | $85,340 | $27,090 | $58,250 |
| 2020 | $2,571 | $85,340 | $27,090 | $58,250 |
| 2019 | $2,498 | $85,340 | $27,090 | $58,250 |
| 2018 | $627 | $85,340 | $27,090 | $58,250 |
| 2017 | $2,416 | $85,340 | $27,090 | $58,250 |
| 2016 | $2,383 | $85,340 | $27,090 | $58,250 |
| 2015 | $2,345 | $85,340 | $27,090 | $58,250 |
| 2014 | $2,284 | $85,340 | $27,090 | $58,250 |
Source: Public Records
Map
Nearby Homes
- 128 E 8th Ave
- 738 Harry St
- 222 E 7th Ave
- 117 W 10th Ave
- 134 W 10th Ave
- 326 E 11th Ave
- 418 E 10th Ave
- 219 W 11th Ave
- 440 E 9th Ave
- 442 E 9th Ave
- 701 Spring Mill Ave
- 911 Righter St
- 389 E Hector St
- 131 W 4th Ave
- 1408 Butler Pike
- 310 W 5th Ave
- 261 E Hector St
- 401 Washington St Unit 312 LEWIS
- 401 Washington St Unit 110 JADWIN
- 401 Washington St Unit 213 LEWIS
Your Personal Tour Guide
Ask me questions while you tour the home.