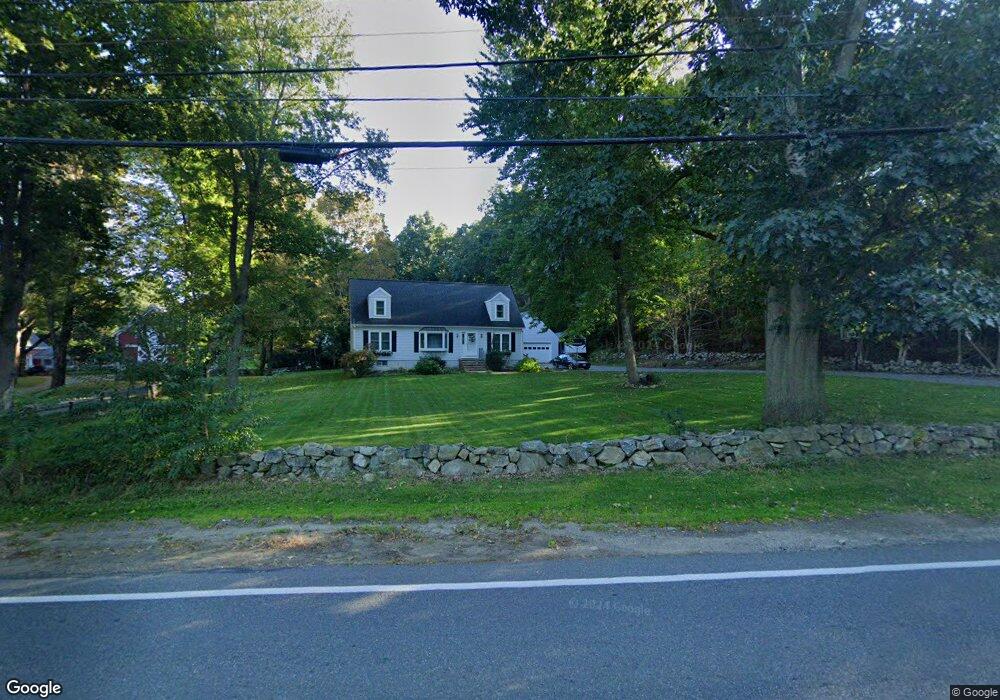
129 Elm St Byfield, MA 01922
Estimated Value: $810,526 - $1,011,000
4
Beds
3
Baths
2,535
Sq Ft
$363/Sq Ft
Est. Value
About This Home
This home is located at 129 Elm St, Byfield, MA 01922 and is currently estimated at $920,882, approximately $363 per square foot. 129 Elm St is a home located in Essex County with nearby schools including Triton Regional High School, North Shore Montessori School, and The Governors Academy.
Ownership History
Date
Name
Owned For
Owner Type
Purchase Details
Closed on
Mar 7, 2003
Sold by
Shorey James R
Bought by
Shorey James R
Current Estimated Value
Purchase Details
Closed on
May 24, 1991
Sold by
Oneill Paul R
Bought by
Shorey James R
Create a Home Valuation Report for This Property
The Home Valuation Report is an in-depth analysis detailing your home's value as well as a comparison with similar homes in the area
Home Values in the Area
Average Home Value in this Area
Purchase History
| Date | Buyer | Sale Price | Title Company |
|---|---|---|---|
| Shorey James R | -- | -- | |
| Shorey James R | -- | -- | |
| Shorey James R | $65,000 | -- | |
| Shorey James R | $65,000 | -- |
Source: Public Records
Mortgage History
| Date | Status | Borrower | Loan Amount |
|---|---|---|---|
| Open | Shorey James R | $368,130 | |
| Closed | Shorey James R | $345,000 |
Source: Public Records
Tax History
| Year | Tax Paid | Tax Assessment Tax Assessment Total Assessment is a certain percentage of the fair market value that is determined by local assessors to be the total taxable value of land and additions on the property. | Land | Improvement |
|---|---|---|---|---|
| 2025 | $5,275 | $708,100 | $320,900 | $387,200 |
| 2024 | $5,268 | $685,900 | $320,900 | $365,000 |
| 2023 | $5,407 | $623,600 | $299,500 | $324,100 |
| 2022 | $5,254 | $540,000 | $256,700 | $283,300 |
| 2021 | $5,162 | $484,200 | $213,900 | $270,300 |
| 2020 | $5,205 | $473,600 | $213,900 | $259,700 |
| 2019 | $5,029 | $465,200 | $213,900 | $251,300 |
| 2018 | $4,770 | $437,600 | $207,500 | $230,100 |
| 2017 | $4,643 | $437,600 | $207,500 | $230,100 |
| 2016 | $4,845 | $425,000 | $192,500 | $232,500 |
| 2015 | $4,403 | $382,200 | $149,700 | $232,500 |
| 2014 | $4,205 | $371,500 | $139,000 | $232,500 |
Source: Public Records
Map
Nearby Homes
- 36 Caldwell Farm Rd
- 601 Newburyport Turnpike
- 1 Osprey Ct
- Lot 6 Osprey Ct
- 304-312 Wethersfield St
- 308 & 312 Wethersfield St
- 34 Central St
- 38 Pearson Dr
- 304 & 480 Wethersfield St & Nbpt Tnpk
- 66 Parish Rd Unit 8
- 55 Pearson Dr Unit 9 - ALDER
- 55 Pearson Dr Unit 8-Dogwood
- 55 Pearson Dr Unit 11-Chestnut
- 55 Pearson Dr Unit 3 - ALDER
- 55 Pearson Dr Unit 6-Dogwood
- 460 - 472 Newburyport Turnpike
- 480 Newburyport Turnpike
- 13 Main St
- 11 Main St
- 38 Main St
Your Personal Tour Guide
Ask me questions while you tour the home.