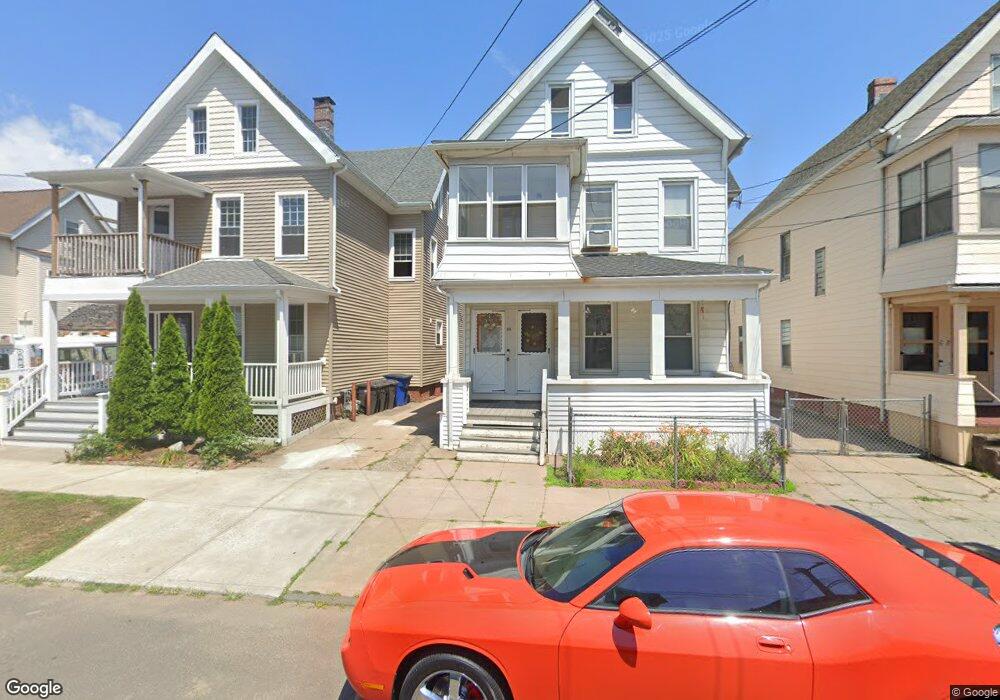
129 Grafton St New Haven, CT 06513
Fair Haven NeighborhoodEstimated Value: $349,234 - $411,000
5
Beds
2
Baths
2,423
Sq Ft
$157/Sq Ft
Est. Value
About This Home
This home is located at 129 Grafton St, New Haven, CT 06513 and is currently estimated at $380,559, approximately $157 per square foot. 129 Grafton St is a home located in New Haven County with nearby schools including Clinton Avenue School, Elm City College Preparatory School, and St Francis & St Rose Of Lima School.
Ownership History
Date
Name
Owned For
Owner Type
Purchase Details
Closed on
Sep 22, 1999
Sold by
Est Lackey Rosina and Berardi Carol
Bought by
Oconnor John H
Current Estimated Value
Home Financials for this Owner
Home Financials are based on the most recent Mortgage that was taken out on this home.
Original Mortgage
$55,400
Outstanding Balance
$16,777
Interest Rate
8.1%
Estimated Equity
$363,782
Create a Home Valuation Report for This Property
The Home Valuation Report is an in-depth analysis detailing your home's value as well as a comparison with similar homes in the area
Home Values in the Area
Average Home Value in this Area
Purchase History
| Date | Buyer | Sale Price | Title Company |
|---|---|---|---|
| Oconnor John H | $57,500 | -- |
Source: Public Records
Mortgage History
| Date | Status | Borrower | Loan Amount |
|---|---|---|---|
| Open | Oconnor John H | $55,400 | |
| Closed | Oconnor John H | $3,000 |
Source: Public Records
Tax History Compared to Growth
Tax History
| Year | Tax Paid | Tax Assessment Tax Assessment Total Assessment is a certain percentage of the fair market value that is determined by local assessors to be the total taxable value of land and additions on the property. | Land | Improvement |
|---|---|---|---|---|
| 2025 | $6,423 | $163,030 | $45,780 | $117,250 |
| 2024 | $6,277 | $163,030 | $45,780 | $117,250 |
| 2023 | $6,065 | $163,030 | $45,780 | $117,250 |
| 2022 | $6,480 | $163,030 | $45,780 | $117,250 |
| 2021 | $4,362 | $99,400 | $32,270 | $67,130 |
| 2020 | $4,362 | $99,400 | $32,270 | $67,130 |
| 2019 | $4,272 | $99,400 | $32,270 | $67,130 |
| 2018 | $4,272 | $99,400 | $32,270 | $67,130 |
| 2017 | $3,845 | $99,400 | $32,270 | $67,130 |
| 2016 | $3,496 | $84,140 | $27,860 | $56,280 |
| 2015 | $3,496 | $84,140 | $27,860 | $56,280 |
| 2014 | $3,496 | $84,140 | $27,860 | $56,280 |
Source: Public Records
Map
Nearby Homes