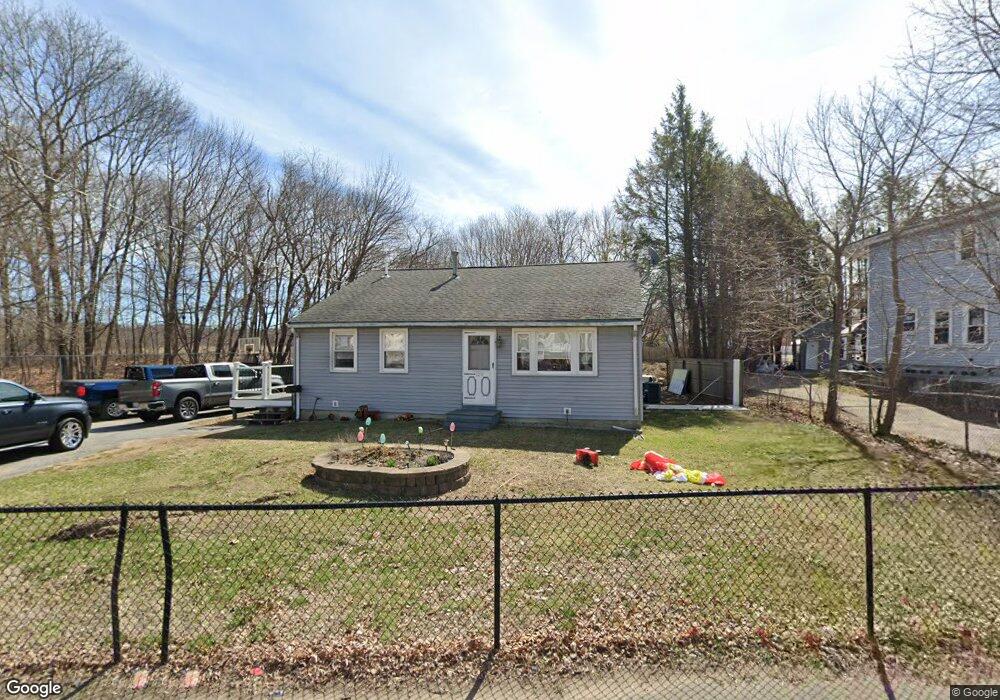
129 Grove St Brockton, MA 02302
Clifton Heights NeighborhoodEstimated Value: $499,000 - $520,000
3
Beds
2
Baths
1,401
Sq Ft
$365/Sq Ft
Est. Value
About This Home
This home is located at 129 Grove St, Brockton, MA 02302 and is currently estimated at $511,729, approximately $365 per square foot. 129 Grove St is a home located in Plymouth County with nearby schools including Davis K-8 School, John F. Kennedy Elementary School, and South Middle School.
Ownership History
Date
Name
Owned For
Owner Type
Purchase Details
Closed on
Sep 15, 2000
Sold by
Voinea George and Voinea Natalia
Bought by
Taylor Thomas E and Taylor Christine D
Current Estimated Value
Purchase Details
Closed on
Jul 24, 1997
Sold by
Citicorp Mtg Inc
Bought by
Voinea George and Voinea Natalia
Purchase Details
Closed on
Mar 24, 1997
Sold by
Busch Darryl Q
Bought by
Citicorp Mtg Inc
Purchase Details
Closed on
Apr 29, 1988
Sold by
Hollstein Richard
Bought by
Busch Darryl Q
Create a Home Valuation Report for This Property
The Home Valuation Report is an in-depth analysis detailing your home's value as well as a comparison with similar homes in the area
Home Values in the Area
Average Home Value in this Area
Purchase History
| Date | Buyer | Sale Price | Title Company |
|---|---|---|---|
| Taylor Thomas E | $152,600 | -- | |
| Voinea George | $75,000 | -- | |
| Citicorp Mtg Inc | $72,000 | -- | |
| Busch Darryl Q | $132,900 | -- |
Source: Public Records
Mortgage History
| Date | Status | Borrower | Loan Amount |
|---|---|---|---|
| Open | Busch Darryl Q | $267,960 | |
| Closed | Busch Darryl Q | $264,767 | |
| Closed | Busch Darryl Q | $255,000 |
Source: Public Records
Tax History Compared to Growth
Tax History
| Year | Tax Paid | Tax Assessment Tax Assessment Total Assessment is a certain percentage of the fair market value that is determined by local assessors to be the total taxable value of land and additions on the property. | Land | Improvement |
|---|---|---|---|---|
| 2025 | $5,356 | $442,300 | $140,900 | $301,400 |
| 2024 | $5,100 | $424,300 | $140,900 | $283,400 |
| 2023 | $5,128 | $395,100 | $108,400 | $286,700 |
| 2022 | $4,416 | $316,100 | $98,600 | $217,500 |
| 2021 | $4,414 | $304,400 | $82,800 | $221,600 |
| 2020 | $4,124 | $272,200 | $76,700 | $195,500 |
| 2019 | $4,124 | $265,400 | $74,500 | $190,900 |
| 2018 | $3,734 | $232,500 | $74,500 | $158,000 |
| 2017 | $3,252 | $202,000 | $74,500 | $127,500 |
| 2016 | $3,463 | $199,500 | $72,500 | $127,000 |
| 2015 | $3,087 | $170,100 | $72,500 | $97,600 |
| 2014 | $3,240 | $178,700 | $72,500 | $106,200 |
Source: Public Records
Map
Nearby Homes