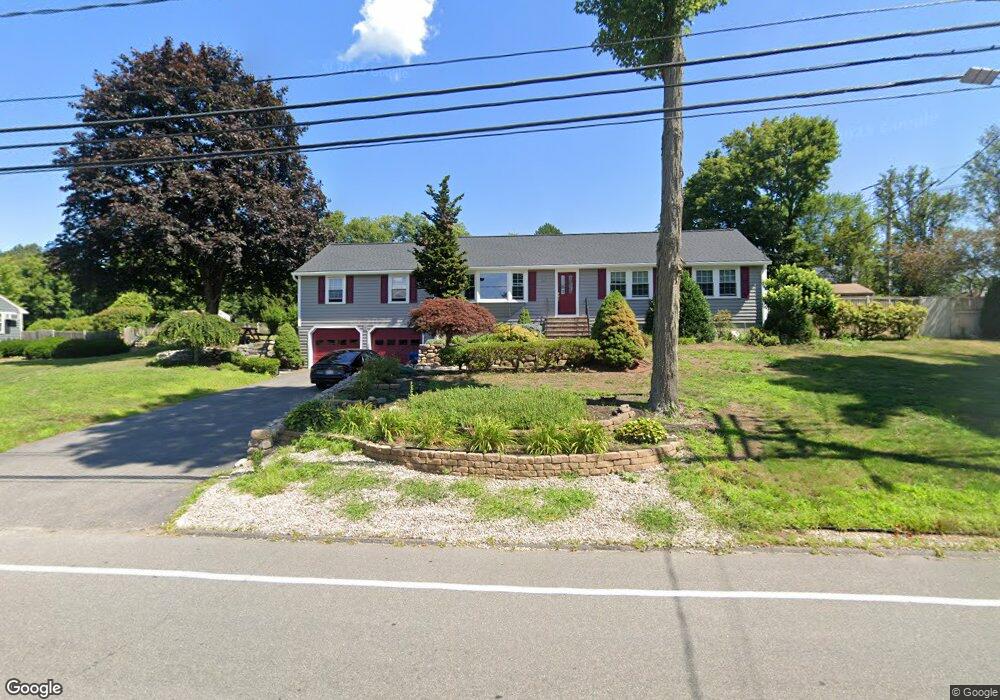
129 Hobart St Danvers, MA 01923
Estimated Value: $725,000 - $928,000
3
Beds
3
Baths
2,814
Sq Ft
$290/Sq Ft
Est. Value
About This Home
This home is located at 129 Hobart St, Danvers, MA 01923 and is currently estimated at $814,656, approximately $289 per square foot. 129 Hobart St is a home located in Essex County with nearby schools including Danvers High School, St. Mary of the Annunciation School, and St. John's Prep.
Ownership History
Date
Name
Owned For
Owner Type
Purchase Details
Closed on
Sep 11, 2025
Sold by
Sauchuk Diana N
Bought by
129 Hobart Street Rt and Sauchuk
Current Estimated Value
Purchase Details
Closed on
Oct 24, 1986
Bought by
Sauchuk Richard L and Sauchuk Diana N
Create a Home Valuation Report for This Property
The Home Valuation Report is an in-depth analysis detailing your home's value as well as a comparison with similar homes in the area
Home Values in the Area
Average Home Value in this Area
Purchase History
| Date | Buyer | Sale Price | Title Company |
|---|---|---|---|
| 129 Hobart Street Rt | -- | -- | |
| Sauchuk Richard L | -- | -- |
Source: Public Records
Mortgage History
| Date | Status | Borrower | Loan Amount |
|---|---|---|---|
| Previous Owner | Sauchuk Richard L | $60,000 | |
| Previous Owner | Sauchuk Richard L | $100,000 | |
| Previous Owner | Sauchuk Richard L | $57,000 | |
| Previous Owner | Sauchuk Richard L | $91,500 |
Source: Public Records
Tax History
| Year | Tax Paid | Tax Assessment Tax Assessment Total Assessment is a certain percentage of the fair market value that is determined by local assessors to be the total taxable value of land and additions on the property. | Land | Improvement |
|---|---|---|---|---|
| 2025 | $7,064 | $642,800 | $357,900 | $284,900 |
| 2024 | $7,104 | $639,400 | $357,900 | $281,500 |
| 2023 | $6,937 | $590,400 | $317,400 | $273,000 |
| 2022 | $6,645 | $524,900 | $276,900 | $248,000 |
| 2021 | $6,137 | $459,700 | $251,200 | $208,500 |
| 2020 | $5,898 | $451,600 | $243,100 | $208,500 |
| 2019 | $5,890 | $443,500 | $235,000 | $208,500 |
| 2018 | $5,671 | $418,800 | $228,300 | $190,500 |
| 2017 | $5,673 | $399,800 | $212,100 | $187,700 |
| 2016 | $5,413 | $381,200 | $202,600 | $178,600 |
| 2015 | $5,075 | $340,400 | $175,600 | $164,800 |
Source: Public Records
Map
Nearby Homes
- 10 Clark St
- 14 Williams St Unit C17
- 22 Collins St Unit 31
- 40 Centre St
- 6 Venice St Unit B3
- 22 Maple Ave
- 57 Adams St
- 63 Adams St
- 4 Butler Ave
- 102 Centre St
- 97 Sylvan St Unit 7
- 35 Locust St Unit 3
- 12 Central Ave Unit 1
- 35 High St Unit 3D
- 20 Central Ave
- 11 Spring St
- 11 Andover St
- 108 Abington Rd Unit 108
- 11 Riverside Ave Unit 111
- 103 Newbury St Unit 1