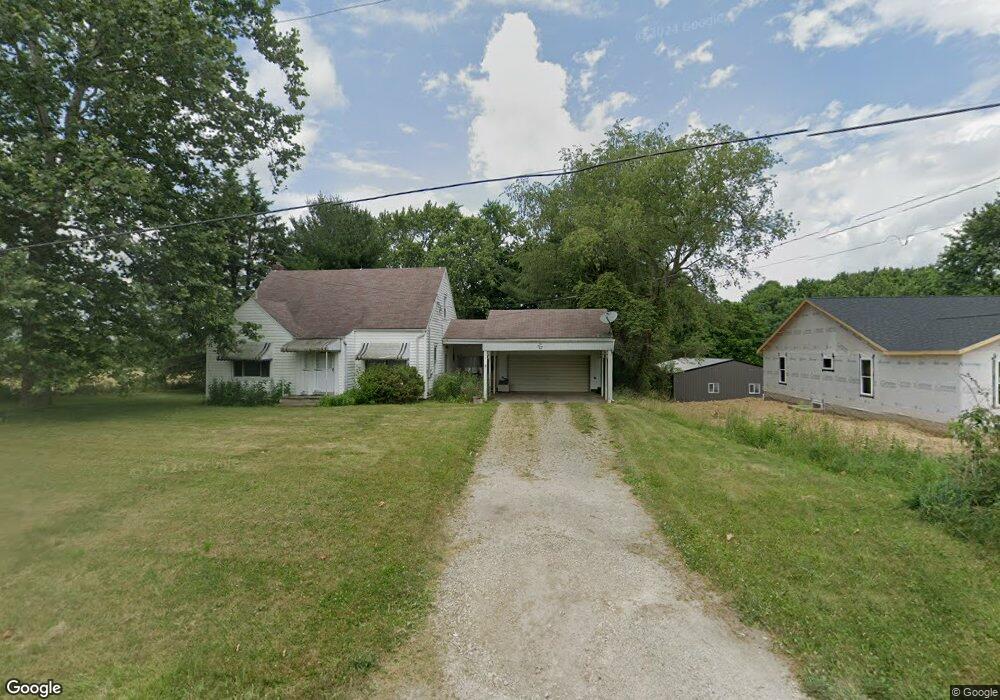
129 Jackson Rd Creston, OH 44217
Estimated Value: $195,000 - $273,000
3
Beds
1
Bath
1,246
Sq Ft
$183/Sq Ft
Est. Value
About This Home
This home is located at 129 Jackson Rd, Creston, OH 44217 and is currently estimated at $227,832, approximately $182 per square foot. 129 Jackson Rd is a home located in Wayne County with nearby schools including Norwayne Elementary School, Norwayne Middle School, and Norwayne High School.
Ownership History
Date
Name
Owned For
Owner Type
Purchase Details
Closed on
Jun 17, 2019
Sold by
Sweigert Michael W and Sweigert Taylor J
Bought by
Sweigert Nicholas J
Current Estimated Value
Home Financials for this Owner
Home Financials are based on the most recent Mortgage that was taken out on this home.
Original Mortgage
$141,414
Outstanding Balance
$124,337
Interest Rate
4.1%
Mortgage Type
New Conventional
Estimated Equity
$103,495
Purchase Details
Closed on
Jun 16, 2017
Sold by
Sweigert Michael W and Sweigert Taylor J
Bought by
Sweigert Michael W and Sweigert Taylor J
Home Financials for this Owner
Home Financials are based on the most recent Mortgage that was taken out on this home.
Original Mortgage
$10,800
Interest Rate
4.05%
Mortgage Type
New Conventional
Purchase Details
Closed on
Jan 15, 2015
Sold by
Porter Nancy J and Slutz Karen S
Bought by
Sweigert Michael W
Home Financials for this Owner
Home Financials are based on the most recent Mortgage that was taken out on this home.
Original Mortgage
$83,673
Interest Rate
3.84%
Mortgage Type
New Conventional
Purchase Details
Closed on
Dec 1, 1993
Sold by
Bowman Max E
Bought by
Bowman Emma Aka Emma L
Create a Home Valuation Report for This Property
The Home Valuation Report is an in-depth analysis detailing your home's value as well as a comparison with similar homes in the area
Purchase History
| Date | Buyer | Sale Price | Title Company |
|---|---|---|---|
| Sweigert Nicholas J | $140,000 | None Available | |
| Sweigert Michael W | -- | Nova Title Agency | |
| Sweigert Michael W | $80,000 | None Available | |
| Bowman Emma Aka Emma L | -- | -- |
Source: Public Records
Mortgage History
| Date | Status | Borrower | Loan Amount |
|---|---|---|---|
| Open | Sweigert Nicholas J | $141,414 | |
| Closed | Sweigert Michael W | $10,800 | |
| Closed | Sweigert Michael W | $83,673 |
Source: Public Records
Tax History
| Year | Tax Paid | Tax Assessment Tax Assessment Total Assessment is a certain percentage of the fair market value that is determined by local assessors to be the total taxable value of land and additions on the property. | Land | Improvement |
|---|---|---|---|---|
| 2024 | $2,587 | $59,520 | $9,310 | $50,210 |
| 2023 | $2,608 | $60,170 | $9,310 | $50,860 |
| 2022 | $2,234 | $44,910 | $6,950 | $37,960 |
| 2021 | $2,024 | $44,910 | $6,950 | $37,960 |
| 2020 | $2,034 | $44,910 | $6,950 | $37,960 |
| 2019 | $1,633 | $36,600 | $7,270 | $29,330 |
| 2018 | $1,245 | $27,730 | $7,270 | $20,460 |
| 2017 | $1,206 | $27,730 | $7,270 | $20,460 |
| 2016 | $1,157 | $26,660 | $6,990 | $19,670 |
| 2015 | $1,176 | $26,660 | $6,990 | $19,670 |
| 2014 | $777 | $26,660 | $6,990 | $19,670 |
| 2013 | $825 | $27,150 | $7,550 | $19,600 |
Source: Public Records
Map
Nearby Homes
- 210 Evergreen Dr
- 104 Wayne Ave
- 124 Garden St
- 112 Brooklyn Ave
- 0 Burbank & Erie St
- 147 N Main St
- 155 Sterling St
- 150 N Main St
- 10368 Wooster Pike
- 747 Britton Rd
- 5913 Stuckey Rd
- 6760 Spruce St
- 9791 Hulbert Rd
- 9376 Daniels Rd
- 2535 Fulton Rd
- 5052 Catawba Place Ln
- 5058 Catawba Place Ln
- 9389 Towpath Trail
- 5222 Greenwich Rd Unit 30
- 5222 Greenwich Rd Unit 11
- 128 Jackson Rd
- 125 Jackson Rd
- 126 Jackson Rd
- 124 Jackson Rd
- 121 Jackson Rd
- 132 Jackson Rd
- 120 Jackson Rd
- 416 S Main St
- 430 S Main St
- 422 S Main St
- 438 S Main St
- 215 Stebbins Dr
- 207 Stebbins Dr
- 207 Stebbins Dr
- 205 Stebbins Dr
- 13112 Cleveland Rd
- 410 S Main St
- 203 Stebbins Dr
- 13267 Cleveland Rd
- 13241 Cleveland Rd
Your Personal Tour Guide
Ask me questions while you tour the home.