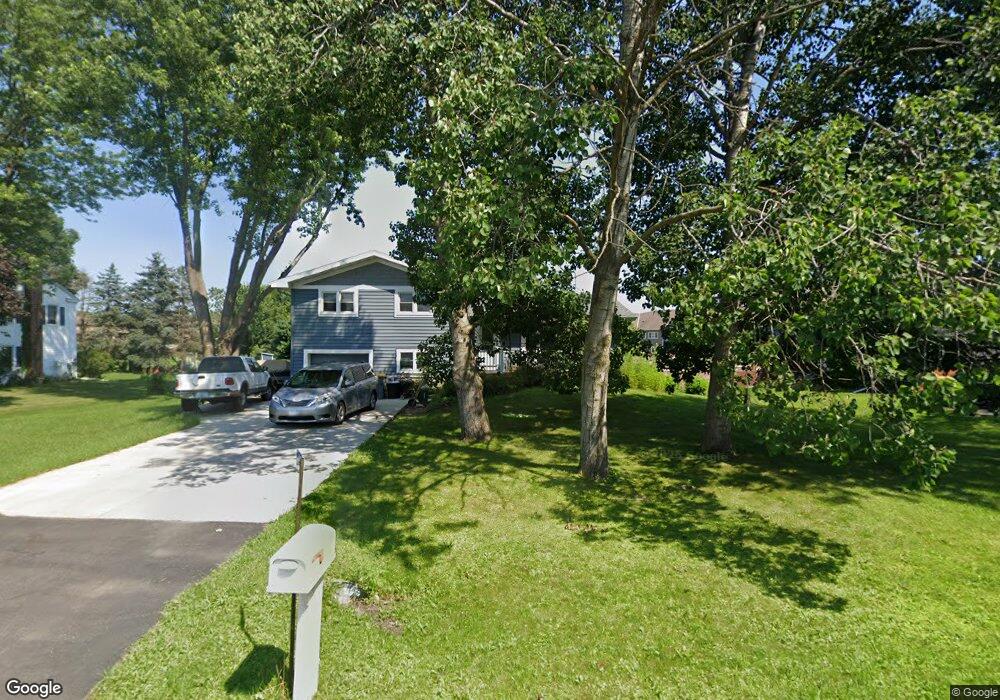
129 Janell Ave La Crescent, MN 55947
Estimated Value: $301,380 - $336,000
3
Beds
2
Baths
1,986
Sq Ft
$157/Sq Ft
Est. Value
About This Home
This home is located at 129 Janell Ave, La Crescent, MN 55947 and is currently estimated at $310,845, approximately $156 per square foot. 129 Janell Ave is a home located in Houston County with nearby schools including La Crescent-Hokah Elementary School, La Crescent-Hokah Middle School, and La Crescent-Hokah High School.
Ownership History
Date
Name
Owned For
Owner Type
Purchase Details
Closed on
Jul 23, 2019
Sold by
Veit Janet D Est
Bought by
Thomason Dane T and Vassillou Nefell
Current Estimated Value
Home Financials for this Owner
Home Financials are based on the most recent Mortgage that was taken out on this home.
Original Mortgage
$151,920
Outstanding Balance
$132,848
Interest Rate
3.73%
Mortgage Type
New Conventional
Estimated Equity
$177,997
Create a Home Valuation Report for This Property
The Home Valuation Report is an in-depth analysis detailing your home's value as well as a comparison with similar homes in the area
Home Values in the Area
Average Home Value in this Area
Purchase History
| Date | Buyer | Sale Price | Title Company |
|---|---|---|---|
| Thomason Dane T | $95,251 | -- | |
| Thompson Dane T | $94,951 | -- |
Source: Public Records
Mortgage History
| Date | Status | Borrower | Loan Amount |
|---|---|---|---|
| Open | Thompson Dane T | $151,920 | |
| Closed | Thomason Dane T | $151,920 |
Source: Public Records
Tax History Compared to Growth
Tax History
| Year | Tax Paid | Tax Assessment Tax Assessment Total Assessment is a certain percentage of the fair market value that is determined by local assessors to be the total taxable value of land and additions on the property. | Land | Improvement |
|---|---|---|---|---|
| 2025 | $3,576 | $293,800 | $62,000 | $231,800 |
| 2024 | $3,476 | $263,600 | $62,000 | $201,600 |
| 2023 | $3,466 | $241,800 | $36,900 | $204,900 |
| 2022 | $2,954 | $241,800 | $36,900 | $204,900 |
| 2021 | $2,934 | $181,600 | $36,900 | $144,700 |
| 2020 | $2,942 | $181,600 | $36,900 | $144,700 |
| 2018 | $5,062 | $163,500 | $36,900 | $126,600 |
| 2017 | $5,062 | $131,900 | $31,530 | $100,370 |
| 2016 | $4,782 | $155,200 | $37,100 | $118,100 |
| 2015 | $1,970 | $146,900 | $35,000 | $111,900 |
| 2014 | $1,970 | $122,900 | $29,282 | $93,618 |
Source: Public Records
Map
Nearby Homes
- 0 County Road 6 Unit 1941351
- 906 Redwood St W
- 604 Hickory Ct
- 0 Hickory Ln
- 906 Redwood St E
- 603 S 5th St
- 220 S Maple St
- 813 Stoney Point Rd
- 912 S Oak St
- 512 N Hill St
- 0 Hill St N
- 540 Jonathan Ln
- Lot 7 & 8 Crescent Hills Dr
- 726 N 4th St
- 221 N 4th St
- 203 Eagles Bluff Rd
- 1115 Jonathan Ln
- 225 Red Apple Dr
- 0 County 6 Rd Unit NST6812247
- 32979 County Road 1