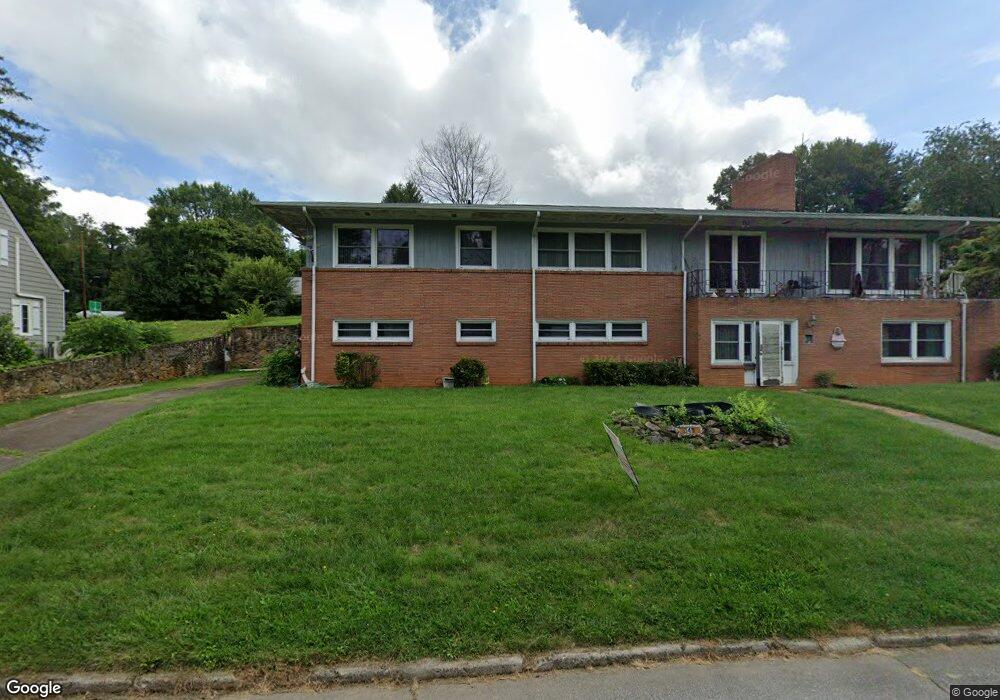
129 Johnson St Canton, NC 28716
Estimated Value: $299,000 - $454,000
5
Beds
3
Baths
2,231
Sq Ft
$171/Sq Ft
Est. Value
About This Home
This home is located at 129 Johnson St, Canton, NC 28716 and is currently estimated at $382,144, approximately $171 per square foot. 129 Johnson St is a home located in Haywood County with nearby schools including Meadowbrook Elementary School, Canton Middle, and Pisgah High School.
Ownership History
Date
Name
Owned For
Owner Type
Purchase Details
Closed on
Aug 19, 2024
Sold by
Downes Oliver W and Downes Mary
Bought by
Huffstutler Hubert A and Napoletano Emily C
Current Estimated Value
Home Financials for this Owner
Home Financials are based on the most recent Mortgage that was taken out on this home.
Original Mortgage
$273,600
Outstanding Balance
$270,551
Interest Rate
6.95%
Mortgage Type
New Conventional
Estimated Equity
$111,593
Purchase Details
Closed on
Oct 30, 1997
Bought by
Downes Oliver W and Downes Mary
Create a Home Valuation Report for This Property
The Home Valuation Report is an in-depth analysis detailing your home's value as well as a comparison with similar homes in the area
Home Values in the Area
Average Home Value in this Area
Purchase History
| Date | Buyer | Sale Price | Title Company |
|---|---|---|---|
| Huffstutler Hubert A | $345,000 | None Listed On Document | |
| Downes Oliver W | $99,000 | -- |
Source: Public Records
Mortgage History
| Date | Status | Borrower | Loan Amount |
|---|---|---|---|
| Open | Huffstutler Hubert A | $273,600 |
Source: Public Records
Tax History
| Year | Tax Paid | Tax Assessment Tax Assessment Total Assessment is a certain percentage of the fair market value that is determined by local assessors to be the total taxable value of land and additions on the property. | Land | Improvement |
|---|---|---|---|---|
| 2025 | -- | $317,600 | $26,600 | $291,000 |
| 2024 | $19 | $317,600 | $26,600 | $291,000 |
| 2023 | $1,858 | $317,600 | $26,600 | $291,000 |
| 2022 | $1,858 | $317,600 | $26,600 | $291,000 |
| 2021 | $1,858 | $317,600 | $26,600 | $291,000 |
| 2020 | $1,395 | $211,200 | $36,600 | $174,600 |
| 2019 | $1,400 | $211,200 | $36,600 | $174,600 |
| 2018 | $1,400 | $211,200 | $36,600 | $174,600 |
| 2017 | $1,136 | $211,200 | $0 | $0 |
| 2016 | $1,212 | $230,100 | $0 | $0 |
| 2015 | $1,212 | $230,100 | $0 | $0 |
| 2014 | $1,094 | $230,100 | $0 | $0 |
Source: Public Records
Map
Nearby Homes
- 121 Johnson St
- 212 Holtzclaw St Unit PT 14-15
- 84 Wood Lily Dr
- 589 Pisgah Dr
- 382 Holtzclaw St
- 163 Pharr St
- 355 Johnson Dr
- TBD Valley St
- 318 Academy St
- 239 Northside St
- 130 Crestview St
- 687 Holtzclaw Rd
- 172 Reed St
- 28 Back Stage Pass
- 131 Skyline Dr Unit 31
- 1397 Dutch Cove Rd
- 00 Bob Wood Dr
- 1254 Pisgah Dr
- 36 Kimberly Dr
- 223 N Main St
Your Personal Tour Guide
Ask me questions while you tour the home.