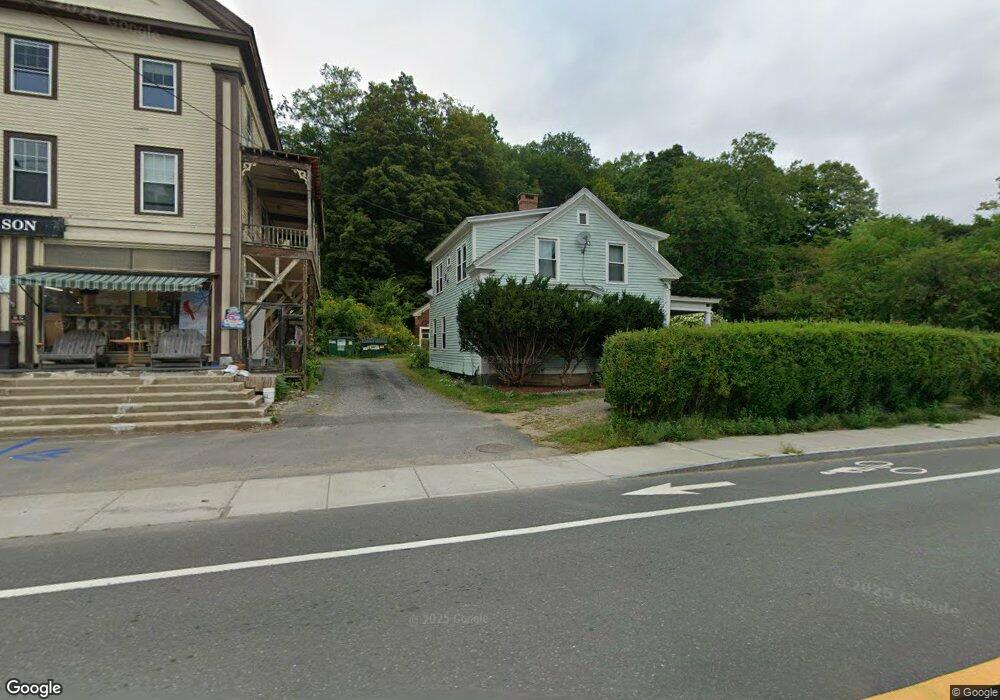
129 Main St Charlemont, MA 01339
Estimated Value: $221,534 - $355,000
4
Beds
2
Baths
2,118
Sq Ft
$140/Sq Ft
Est. Value
About This Home
This home is located at 129 Main St, Charlemont, MA 01339 and is currently estimated at $296,134, approximately $139 per square foot. 129 Main St is a home located in Franklin County with nearby schools including Mohawk Trail Regional High School and The Academy At Charlemont.
Ownership History
Date
Name
Owned For
Owner Type
Purchase Details
Closed on
Jun 30, 2021
Sold by
Filan Wayne D
Bought by
Porter-Devriese Timothy J and Busayathip Busara K
Current Estimated Value
Home Financials for this Owner
Home Financials are based on the most recent Mortgage that was taken out on this home.
Original Mortgage
$130,000
Outstanding Balance
$117,442
Interest Rate
2.9%
Mortgage Type
Purchase Money Mortgage
Estimated Equity
$178,692
Purchase Details
Closed on
Jun 13, 2007
Sold by
Avery Dennis C and Hogness Karen L
Bought by
Porter Rachel D and Filan Wayne D
Home Financials for this Owner
Home Financials are based on the most recent Mortgage that was taken out on this home.
Original Mortgage
$132,000
Interest Rate
6.19%
Mortgage Type
Purchase Money Mortgage
Create a Home Valuation Report for This Property
The Home Valuation Report is an in-depth analysis detailing your home's value as well as a comparison with similar homes in the area
Home Values in the Area
Average Home Value in this Area
Purchase History
| Date | Buyer | Sale Price | Title Company |
|---|---|---|---|
| Porter-Devriese Timothy J | $140,000 | None Available | |
| Porter-Devriese Timothy J | $140,000 | None Available | |
| Porter Rachel D | $139,000 | -- | |
| Porter Rachel D | $139,000 | -- |
Source: Public Records
Mortgage History
| Date | Status | Borrower | Loan Amount |
|---|---|---|---|
| Open | Porter-Devriese Timothy J | $130,000 | |
| Closed | Porter-Devriese Timothy J | $130,000 | |
| Previous Owner | Porter Rachel D | $127,200 | |
| Previous Owner | Porter Rachel D | $132,000 |
Source: Public Records
Tax History Compared to Growth
Tax History
| Year | Tax Paid | Tax Assessment Tax Assessment Total Assessment is a certain percentage of the fair market value that is determined by local assessors to be the total taxable value of land and additions on the property. | Land | Improvement |
|---|---|---|---|---|
| 2025 | $3,592 | $196,300 | $27,400 | $168,900 |
| 2024 | $4,266 | $206,100 | $25,000 | $181,100 |
| 2023 | $4,027 | $195,200 | $23,000 | $172,200 |
| 2022 | $3,991 | $192,500 | $23,000 | $169,500 |
| 2021 | $3,942 | $192,500 | $23,000 | $169,500 |
| 2020 | $3,580 | $183,500 | $22,900 | $160,600 |
| 2019 | $3,620 | $183,500 | $22,900 | $160,600 |
| 2018 | $3,747 | $183,500 | $22,900 | $160,600 |
| 2017 | $3,707 | $183,500 | $22,900 | $160,600 |
| 2016 | $3,363 | $171,600 | $22,900 | $148,700 |
| 2015 | $3,068 | $171,600 | $22,900 | $148,700 |
Source: Public Records
Map
Nearby Homes
- 174 Main St
- 0 Warfield Rd
- 0 E Hawley Rd Unit 73456358
- 2153 Massachusetts 2
- 766 Tea St
- 49 East Rd
- 0 Maxwell Rd Unit 246884
- 0 W Hawley Rd
- 63 W Hawley Rd
- 0, Lot 7 East Rd
- Lot 3.2 East Rd
- 0 Potters Rd Unit 73439831
- 559 Tea St
- 153 E Hawley Rd
- 143 Charlemont Rd
- 0 W Oxbow Rd Unit 73453651
- 41 Buckland Rd
- 292 E Hawley Rd
- 14 South Rd
- 24 W Oxbow Rd