S
Seller's Agent in 2014
Suzanne Doisneau
Tower Hill Real Estate
Estimated Value: $2,451,098 - $2,767,000
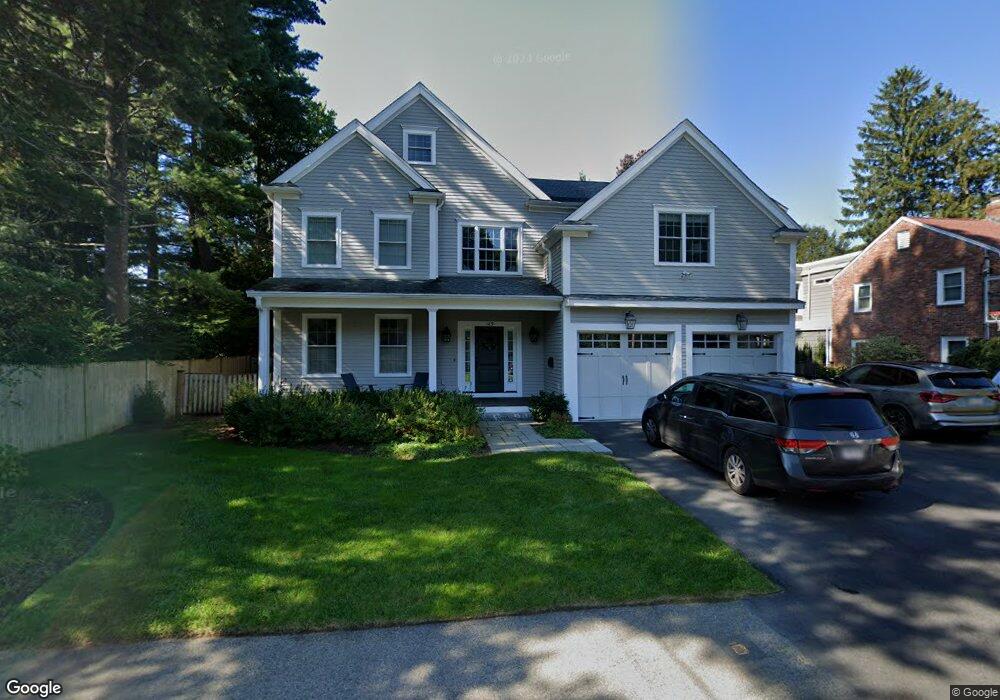
Beautiful new construction by well respected, local builder. Walk to Mitchel School, Middle and High School. Convenient walk to town and train. Detailed finishes throughout including moldings, tray ceilings and built-ins. Custom-built chef's gas kitchen with granite tops and stainless appliances . First floor pantry and spacious mudroom. Five large bedrooms on 2nd floor. Finished 3rd floor with office or 6th bedroom plus TV room and full bath. Professionally landscaped with extra deep, level back yard. Perfect time to customize now.
Last Agent to Sell the Property
Suzanne Doisneau
Tower Hill Real Estate Listed on: 06/04/2014
Home Type
Other
Est. Annual Taxes
$23,390
Year Built
2013
Lot Details
0
| Date | Buyer | Sale Price | Title Company |
|---|---|---|---|
| Vignos James H | -- | -- | |
| Vignos James H | -- | -- |
| Date | Status | Borrower | Loan Amount |
|---|---|---|---|
| Open | Vignos James H | $1,060,000 |
| Date | Event | Price | List to Sale | Price per Sq Ft | Prior Sale |
|---|---|---|---|---|---|
| 06/04/2014 06/04/14 | Sold | $1,400,000 | 0.0% | $311 / Sq Ft | |
| 06/04/2014 06/04/14 | For Sale | $1,400,000 | 0.0% | $311 / Sq Ft | |
| 05/16/2014 05/16/14 | Sold | $1,400,000 | 0.0% | $311 / Sq Ft | View Prior Sale |
| 09/15/2013 09/15/13 | Off Market | $1,400,000 | -- | -- | |
| 08/10/2013 08/10/13 | For Sale | $1,449,000 | -- | $322 / Sq Ft |
| Year | Tax Paid | Tax Assessment Tax Assessment Total Assessment is a certain percentage of the fair market value that is determined by local assessors to be the total taxable value of land and additions on the property. | Land | Improvement |
|---|---|---|---|---|
| 2025 | $23,390 | $2,206,600 | $775,900 | $1,430,700 |
| 2024 | $24,909 | $1,989,500 | $554,200 | $1,435,300 |
| 2023 | $22,520 | $1,727,000 | $554,200 | $1,172,800 |
| 2022 | $21,330 | $1,595,400 | $486,400 | $1,109,000 |
| 2021 | $20,788 | $1,595,400 | $486,400 | $1,109,000 |
| 2020 | $19,516 | $1,562,500 | $486,400 | $1,076,100 |
| 2019 | $18,630 | $1,503,600 | $442,400 | $1,061,200 |
| 2018 | $17,863 | $1,503,600 | $442,400 | $1,061,200 |
| 2017 | $16,212 | $1,363,500 | $442,400 | $921,100 |
| 2016 | $15,739 | $1,363,900 | $442,400 | $921,500 |
| 2015 | $15,398 | $1,363,900 | $442,400 | $921,500 |
| 2014 | $6,493 | $557,800 | $402,400 | $155,400 |
S
Seller's Agent in 2014
Suzanne Doisneau
Tower Hill Real Estate

Buyer's Agent in 2014
Jamie Genser
Coldwell Banker Realty - Brookline
(617) 515-5152
8 in this area
130 Total Sales
Source: MLS Property Information Network (MLS PIN)
MLS Number: 71692812
APN: NEED-000061-000016
Disclaimer: Certain information contained herein is derived from information provided by parties other than Homes.com. All information provided is deemed reliable, but is not guaranteed to be accurate and should be independently verified.
![]() The property listing data and information, or the Images, set forth herein were provided to MLS Property Information Network, Inc. from third party sources, including sellers, lessors and public records, and were compiled by MLS Property Information Network, Inc. The property listing data and information, and the Images, are for the personal, non-commercial use of consumers having a good faith interest in purchasing or leasing listed properties of the type displayed to them and may not be used for any purpose other than to identify prospective properties which such consumers may have a good faith interest in purchasing or leasing. MLS Property Information Network, Inc. and its subscribers disclaim any and all representations and warranties as to the accuracy of the property listing data and information, or as to the accuracy of any of the Images, set forth herein.
The property listing data and information, or the Images, set forth herein were provided to MLS Property Information Network, Inc. from third party sources, including sellers, lessors and public records, and were compiled by MLS Property Information Network, Inc. The property listing data and information, and the Images, are for the personal, non-commercial use of consumers having a good faith interest in purchasing or leasing listed properties of the type displayed to them and may not be used for any purpose other than to identify prospective properties which such consumers may have a good faith interest in purchasing or leasing. MLS Property Information Network, Inc. and its subscribers disclaim any and all representations and warranties as to the accuracy of the property listing data and information, or as to the accuracy of any of the Images, set forth herein.