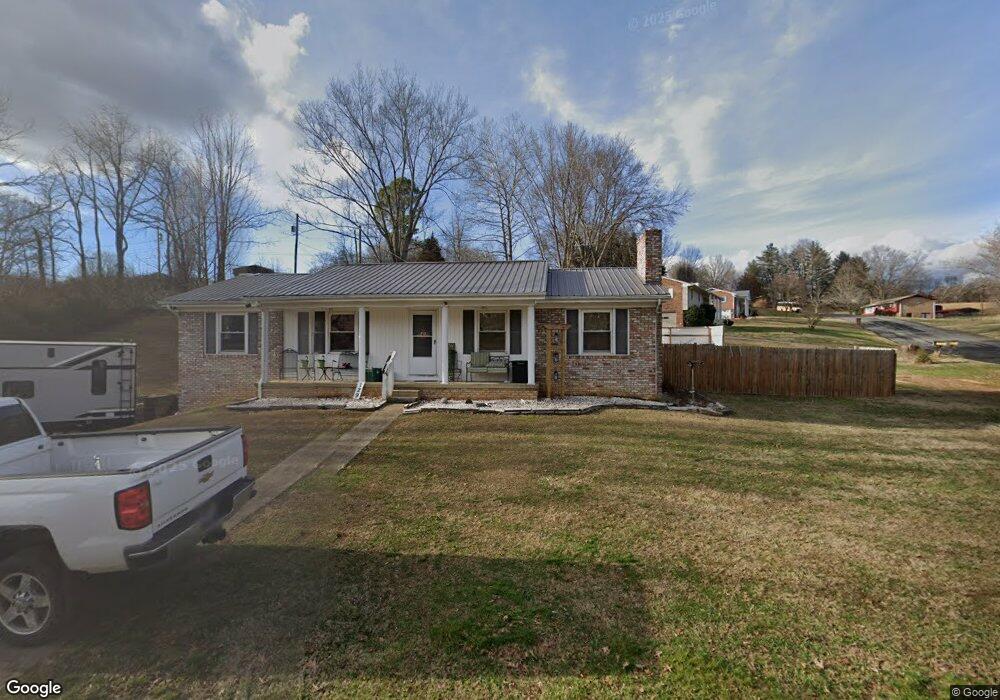
129 Montezuma Rd Kingsport, TN 37664
Estimated Value: $300,945 - $341,000
--
Bed
2
Baths
1,377
Sq Ft
$232/Sq Ft
Est. Value
About This Home
This home is located at 129 Montezuma Rd, Kingsport, TN 37664 and is currently estimated at $319,236, approximately $231 per square foot. 129 Montezuma Rd is a home located in Sullivan County with nearby schools including Indian Springs Elementary School and Sullivan Central Middle School.
Ownership History
Date
Name
Owned For
Owner Type
Purchase Details
Closed on
Oct 19, 2017
Sold by
Cross Lewis Clyde and Cross Mary
Bought by
Cross Katie and Cross Michael
Current Estimated Value
Home Financials for this Owner
Home Financials are based on the most recent Mortgage that was taken out on this home.
Original Mortgage
$124,186
Outstanding Balance
$105,302
Interest Rate
4.4%
Mortgage Type
FHA
Estimated Equity
$213,934
Purchase Details
Closed on
Sep 30, 2008
Sold by
Blix Darin L
Bought by
Cross Lewis Clyde
Home Financials for this Owner
Home Financials are based on the most recent Mortgage that was taken out on this home.
Original Mortgage
$133,950
Interest Rate
6.34%
Purchase Details
Closed on
Jun 15, 2005
Sold by
Blix Kelly J
Bought by
Blix Darin L
Create a Home Valuation Report for This Property
The Home Valuation Report is an in-depth analysis detailing your home's value as well as a comparison with similar homes in the area
Home Values in the Area
Average Home Value in this Area
Purchase History
| Date | Buyer | Sale Price | Title Company |
|---|---|---|---|
| Cross Katie | -- | Old Republic Title | |
| Cross Lewis Clyde | $141,000 | -- | |
| Blix Darin L | -- | -- |
Source: Public Records
Mortgage History
| Date | Status | Borrower | Loan Amount |
|---|---|---|---|
| Open | Cross Katie | $124,186 | |
| Closed | Blix Darin L | $133,950 |
Source: Public Records
Tax History Compared to Growth
Tax History
| Year | Tax Paid | Tax Assessment Tax Assessment Total Assessment is a certain percentage of the fair market value that is determined by local assessors to be the total taxable value of land and additions on the property. | Land | Improvement |
|---|---|---|---|---|
| 2024 | $942 | $37,750 | $7,400 | $30,350 |
| 2023 | $908 | $37,750 | $7,400 | $30,350 |
| 2022 | $908 | $37,750 | $7,400 | $30,350 |
| 2021 | $908 | $37,750 | $7,400 | $30,350 |
| 2020 | $875 | $37,750 | $7,400 | $30,350 |
| 2019 | $875 | $34,050 | $7,400 | $26,650 |
| 2018 | $868 | $34,050 | $7,400 | $26,650 |
| 2017 | $868 | $34,050 | $7,400 | $26,650 |
| 2016 | $862 | $33,475 | $8,325 | $25,150 |
| 2014 | $771 | $33,462 | $0 | $0 |
Source: Public Records
Map
Nearby Homes
- 5509 Memorial Blvd
- 5404 Memorial Blvd
- 316 Montezuma Rd
- 416 S Valley View Cir
- 5821 Seneca Dr
- 5825 Cochise Trail
- 125 Golf Ridge Dr
- Lot 3 Country Dr
- Lot 2 Country Dr
- Lot 21 Country Dr
- 708 Hill Rd
- 285 Spurgeon Rd
- 509 Amelia Ct
- 295 Southridge Dr
- 121 Southridge Dr
- 309 Golf Ridge Dr
- 128 Southridge Dr
- 0 Foxfire Ln
- 338 Golf Ridge Dr
- 732 Shadowtown Rd
- 129 Montezuma Rd Unit 1
- 5528 Kiowa St
- 201 Montezuma Rd
- 121 Montezuma Rd
- 5529 Kiowa St
- 5524 Kiowa St
- 200 Montezuma Rd
- 128 Satanta Rd
- 132 Satanta Rd
- 117 Montezuma Rd
- 204 Montezuma Rd
- 205 Montezuma Rd
- 134 Satanta Rd
- 124 Satanta Rd
- 120 Satanta Rd
- 208 Montezuma Rd
- 5541 Kiowa St
- 113 Montezuma Rd
- 136 Satanta Rd
- 116 Satanta Rd