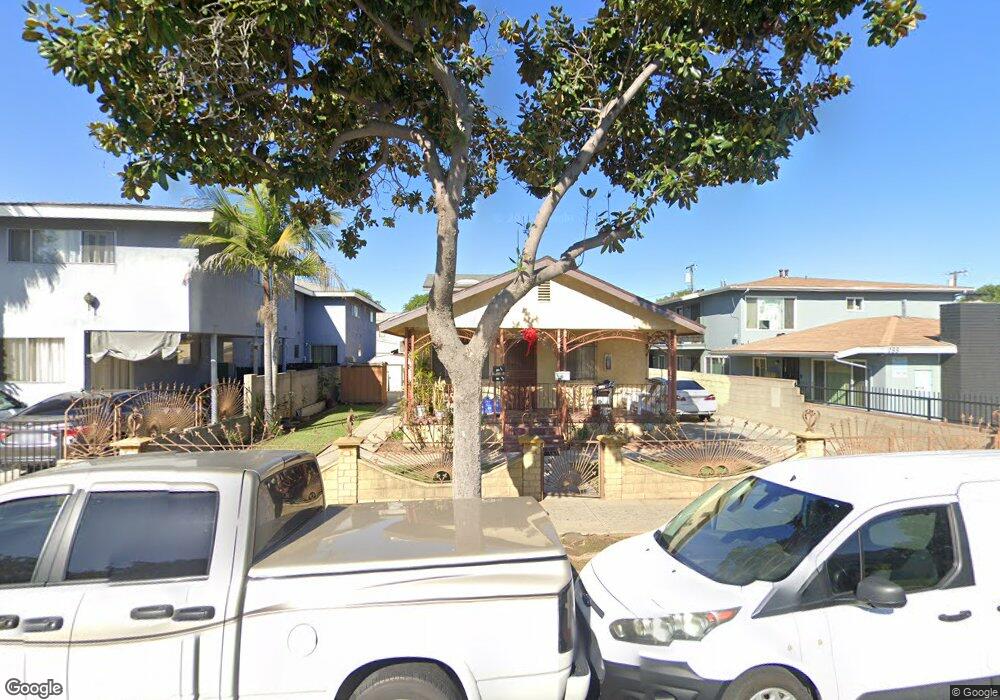
129 N 2nd St Montebello, CA 90640
Estimated Value: $1,005,000 - $1,095,000
6
Beds
4
Baths
2,416
Sq Ft
$440/Sq Ft
Est. Value
About This Home
This home is located at 129 N 2nd St, Montebello, CA 90640 and is currently estimated at $1,063,000, approximately $439 per square foot. 129 N 2nd St is a home located in Los Angeles County with nearby schools including Fremont Elementary School, La Merced Intermediate School, and Montebello High School.
Ownership History
Date
Name
Owned For
Owner Type
Purchase Details
Closed on
Nov 20, 2018
Sold by
Cortez Baudelio
Bought by
Cortez Baudelio and The Baudelio Cortez Living Tru
Current Estimated Value
Create a Home Valuation Report for This Property
The Home Valuation Report is an in-depth analysis detailing your home's value as well as a comparison with similar homes in the area
Home Values in the Area
Average Home Value in this Area
Purchase History
| Date | Buyer | Sale Price | Title Company |
|---|---|---|---|
| Cortez Baudelio | -- | None Available |
Source: Public Records
Tax History Compared to Growth
Tax History
| Year | Tax Paid | Tax Assessment Tax Assessment Total Assessment is a certain percentage of the fair market value that is determined by local assessors to be the total taxable value of land and additions on the property. | Land | Improvement |
|---|---|---|---|---|
| 2025 | $3,480 | $119,997 | $33,794 | $86,203 |
| 2024 | $3,480 | $117,645 | $33,132 | $84,513 |
| 2023 | $3,428 | $115,339 | $32,483 | $82,856 |
| 2022 | $3,318 | $113,079 | $31,847 | $81,232 |
| 2021 | $3,163 | $110,863 | $31,223 | $79,640 |
| 2020 | $3,004 | $109,727 | $30,903 | $78,824 |
| 2019 | $2,950 | $107,577 | $30,298 | $77,279 |
| 2018 | $2,881 | $105,468 | $29,704 | $75,764 |
| 2016 | $2,767 | $101,374 | $28,551 | $72,823 |
| 2015 | $2,677 | $99,853 | $28,123 | $71,730 |
| 2014 | $2,670 | $97,898 | $27,573 | $70,325 |
Source: Public Records
Map
Nearby Homes
- 416 W Cleveland Ave
- 701 W Madison Ave
- 272 Maiden Ln
- 525 N 3rd St
- 424 Bradley Ave
- 4753 Orange St
- 524 N Poplar Ave
- 4724 Orange St
- 4709 Grape St
- 133 N Greenwood Ave
- 415 S 6th St
- 224 S Greenwood Ave
- 219 S Greenwood Ave
- 425 Valera Dr
- 1013 Eucalipto Place
- 4758 Oak St
- 217 Dochan Cir
- 4653 Pine St
- 8421 Culp Dr
- 1325 Charleston Way