129 N 7th St Tipp City, OH 45371
Estimated Value: $172,000 - $221,000
2
Beds
1
Bath
1,399
Sq Ft
$140/Sq Ft
Est. Value
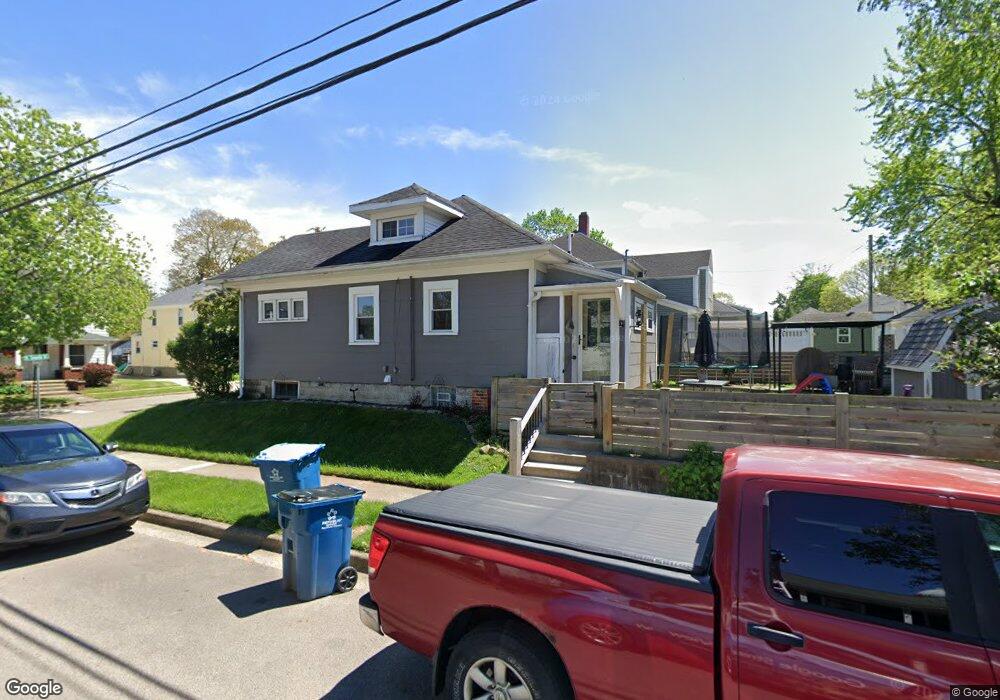
About This Home
This home is located at 129 N 7th St, Tipp City, OH 45371 and is currently estimated at $195,839, approximately $139 per square foot. 129 N 7th St is a home located in Miami County with nearby schools including Broadway Elementary School, Nevin Coppock Elementary School, and L. T. Ball Intermediate School.
Ownership History
Date
Name
Owned For
Owner Type
Purchase Details
Closed on
Jan 30, 2009
Sold by
Herring Adam Scott
Bought by
Herring Alex O and Herring Christine
Current Estimated Value
Purchase Details
Closed on
Sep 16, 2004
Sold by
Seigle Jane F
Bought by
Herring Adam
Home Financials for this Owner
Home Financials are based on the most recent Mortgage that was taken out on this home.
Original Mortgage
$83,686
Interest Rate
6.08%
Mortgage Type
FHA
Purchase Details
Closed on
Jul 10, 2001
Sold by
Seigle Walter R
Bought by
Seigle Jane F
Purchase Details
Closed on
Jan 1, 1990
Bought by
Seigle Walter R
Create a Home Valuation Report for This Property
The Home Valuation Report is an in-depth analysis detailing your home's value as well as a comparison with similar homes in the area
Home Values in the Area
Average Home Value in this Area
Purchase History
| Date | Buyer | Sale Price | Title Company |
|---|---|---|---|
| Herring Alex O | $79,295 | -- | |
| Herring Adam | $85,000 | -- | |
| Seigle Jane F | -- | -- | |
| Seigle Walter R | -- | -- |
Source: Public Records
Mortgage History
| Date | Status | Borrower | Loan Amount |
|---|---|---|---|
| Previous Owner | Seigle Jane F | $83,686 |
Source: Public Records
Tax History Compared to Growth
Tax History
| Year | Tax Paid | Tax Assessment Tax Assessment Total Assessment is a certain percentage of the fair market value that is determined by local assessors to be the total taxable value of land and additions on the property. | Land | Improvement |
|---|---|---|---|---|
| 2024 | $1,952 | $39,210 | $6,200 | $33,010 |
| 2023 | $1,952 | $39,210 | $6,200 | $33,010 |
| 2022 | $1,779 | $39,210 | $6,200 | $33,010 |
| 2021 | $1,508 | $30,140 | $4,760 | $25,380 |
| 2020 | $1,527 | $30,140 | $4,760 | $25,380 |
| 2019 | $1,541 | $30,140 | $4,760 | $25,380 |
| 2018 | $1,532 | $27,970 | $5,150 | $22,820 |
| 2017 | $1,538 | $27,970 | $5,150 | $22,820 |
| 2016 | $1,486 | $27,970 | $5,150 | $22,820 |
| 2015 | $1,298 | $25,900 | $4,760 | $21,140 |
| 2014 | $1,298 | $25,900 | $4,760 | $21,140 |
| 2013 | $1,305 | $25,900 | $4,760 | $21,140 |
Source: Public Records
Map
Nearby Homes