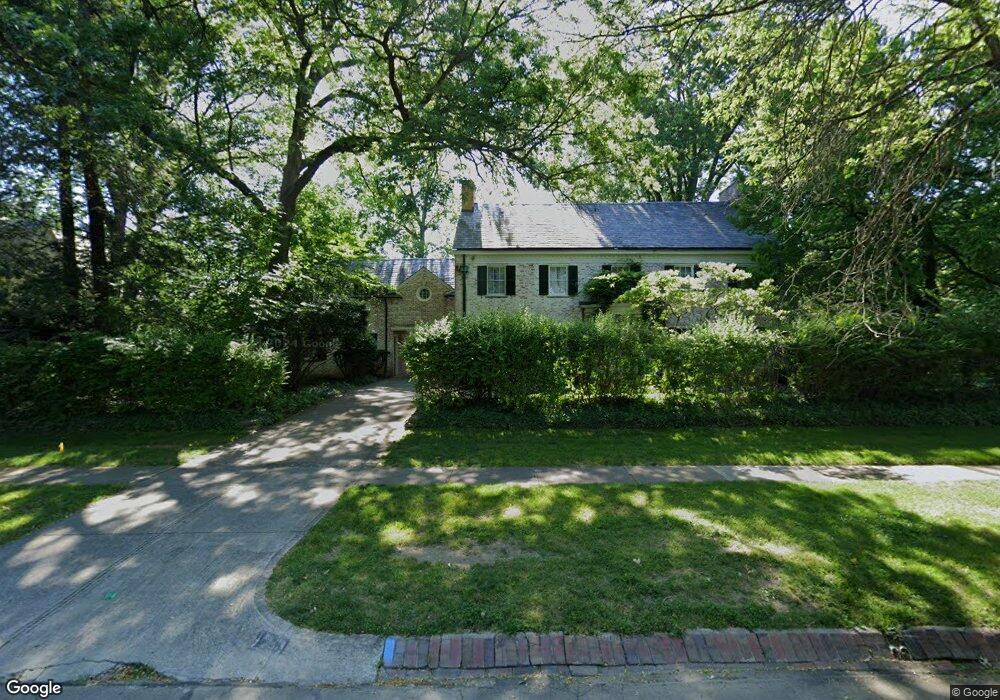
129 N Columbia Ave Columbus, OH 43209
Estimated Value: $1,398,000 - $1,796,000
5
Beds
4
Baths
4,508
Sq Ft
$344/Sq Ft
Est. Value
About This Home
This home is located at 129 N Columbia Ave, Columbus, OH 43209 and is currently estimated at $1,549,644, approximately $343 per square foot. 129 N Columbia Ave is a home located in Franklin County with nearby schools including Maryland Elementary School, Bexley Middle School, and Bexley High School.
Ownership History
Date
Name
Owned For
Owner Type
Purchase Details
Closed on
Jun 27, 2024
Sold by
Eibsee Llc
Bought by
Stanley Audrey and Stanley Paul
Current Estimated Value
Home Financials for this Owner
Home Financials are based on the most recent Mortgage that was taken out on this home.
Original Mortgage
$476,000
Outstanding Balance
$470,315
Interest Rate
6.99%
Mortgage Type
New Conventional
Estimated Equity
$1,079,329
Purchase Details
Closed on
Dec 12, 2023
Sold by
Joan F Wobst Trust
Bought by
Eibsee Llc
Purchase Details
Closed on
Jun 7, 2017
Sold by
Wobst Joan F
Bought by
Wobst Franck G and Joan F Wobst Trust
Purchase Details
Closed on
Apr 7, 2010
Sold by
Estate Of Frank G Wobst
Bought by
Wobst Joan F
Purchase Details
Closed on
Mar 29, 1977
Bought by
Wobst Frank and Wobst Joan F
Create a Home Valuation Report for This Property
The Home Valuation Report is an in-depth analysis detailing your home's value as well as a comparison with similar homes in the area
Home Values in the Area
Average Home Value in this Area
Purchase History
| Date | Buyer | Sale Price | Title Company |
|---|---|---|---|
| Stanley Audrey | -- | Leaders Title Agency | |
| Eibsee Llc | $1,300,000 | Clean Title | |
| Wobst Franck G | -- | None Available | |
| Wobst Joan F | -- | None Available | |
| Wobst Frank | -- | -- |
Source: Public Records
Mortgage History
| Date | Status | Borrower | Loan Amount |
|---|---|---|---|
| Open | Stanley Audrey | $476,000 |
Source: Public Records
Tax History Compared to Growth
Tax History
| Year | Tax Paid | Tax Assessment Tax Assessment Total Assessment is a certain percentage of the fair market value that is determined by local assessors to be the total taxable value of land and additions on the property. | Land | Improvement |
|---|---|---|---|---|
| 2024 | $24,626 | $443,450 | $145,600 | $297,850 |
| 2023 | $22,616 | $443,450 | $145,600 | $297,850 |
| 2022 | $21,550 | $339,440 | $103,850 | $235,590 |
| 2021 | $21,567 | $339,440 | $103,850 | $235,590 |
| 2020 | $21,381 | $339,440 | $103,850 | $235,590 |
| 2019 | $22,110 | $308,810 | $94,400 | $214,410 |
| 2018 | $9,639 | $308,810 | $94,400 | $214,410 |
| 2017 | $18,844 | $308,810 | $94,400 | $214,410 |
| 2016 | $21,326 | $319,310 | $94,540 | $224,770 |
| 2015 | $10,701 | $319,310 | $94,540 | $224,770 |
| 2014 | $21,524 | $319,310 | $94,540 | $224,770 |
| 2013 | $10,170 | $290,255 | $85,925 | $204,330 |
Source: Public Records
Map
Nearby Homes
- 189 N Parkview Ave
- 291 N Drexel Ave
- 82 Bishop Square
- 57 Preston Rd
- 49 N Cassingham Rd
- 2629 E Broad St
- 440 N Nelson Rd
- 2717 E Broad St
- 211 Preston Rd
- 2029 Maryland Ave
- 2738 E Broad St
- 2731 E Broad St
- 2455 Dale Ave
- 268 S Cassady Ave
- 1880 Greenway Ave S
- 125 S Stanwood Rd
- 1872 Greenway Ave S
- 2695 Bellwood Ave
- 208 S Stanwood Rd
- 2779 Columbus Ave
- 2299 Commonwealth Park S
- 107 N Columbia Ave
- 2355 Commonwealth Park S
- 91 N Columbia Ave
- 90 N Columbia Ave
- 2292 Clifton Ave
- 171 N Columbia Ave
- 140 N Parkview Ave
- 0 Clifton Ave
- 2371 Commonwealth Park S
- 112 N Parkview Ave
- 102 N Parkview Ave
- 2291 Clifton Ave
- 63 N Columbia Ave
- 295 N Parkview Ave
- 297 N Parkview Ave
- 0 N Parkview Ave
- 0 N Parkview Ave
- 81 N Drexel Ave
- 80 N Parkview Ave