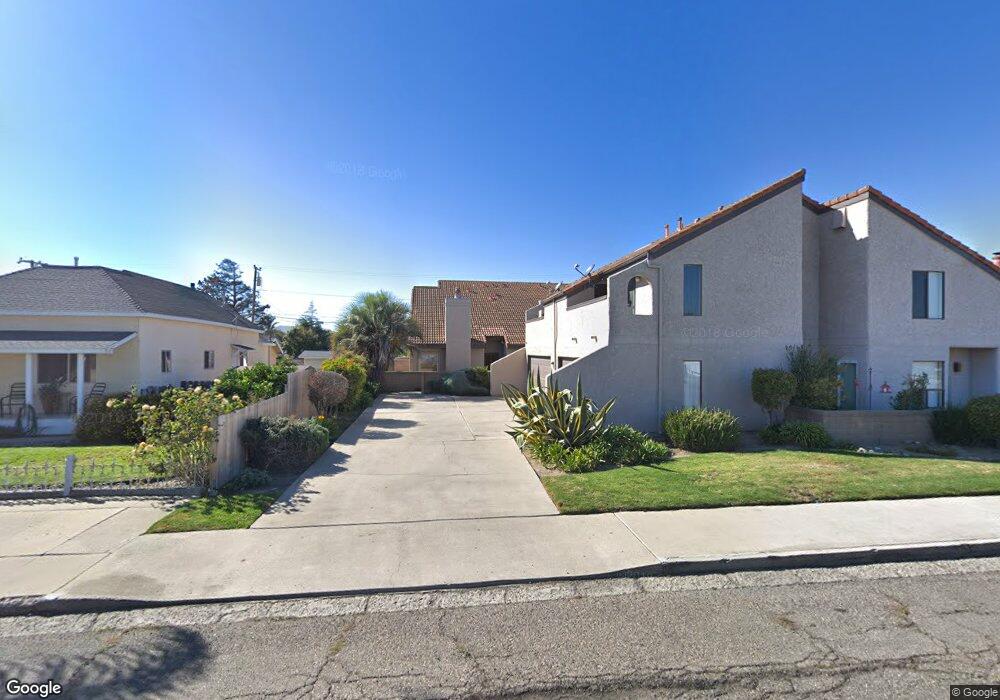
129 N J St Lompoc, CA 93436
Estimated Value: $373,000 - $441,000
2
Beds
2
Baths
1,362
Sq Ft
$295/Sq Ft
Est. Value
About This Home
This home is located at 129 N J St, Lompoc, CA 93436 and is currently estimated at $402,119, approximately $295 per square foot. 129 N J St is a home located in Santa Barbara County with nearby schools including Arthur Hapgood Elementary School, Lompoc Valley Middle School, and Lompoc High School.
Ownership History
Date
Name
Owned For
Owner Type
Purchase Details
Closed on
Sep 24, 2008
Sold by
Welter Volker Werner Maria
Bought by
Welter Volker W M
Current Estimated Value
Purchase Details
Closed on
Aug 10, 2006
Sold by
Mitchell Leroy C and Mitchell Mary K
Bought by
Welter Volker Werner Maria
Home Financials for this Owner
Home Financials are based on the most recent Mortgage that was taken out on this home.
Original Mortgage
$269,000
Outstanding Balance
$217,273
Interest Rate
6.67%
Mortgage Type
Unknown
Estimated Equity
$184,846
Purchase Details
Closed on
Jun 29, 2006
Sold by
Mitchell Leroy C and Mitchell Mary K
Bought by
Mitchell Leroy C and Mitchell Mary K
Home Financials for this Owner
Home Financials are based on the most recent Mortgage that was taken out on this home.
Original Mortgage
$269,000
Outstanding Balance
$217,273
Interest Rate
6.67%
Mortgage Type
Unknown
Estimated Equity
$184,846
Create a Home Valuation Report for This Property
The Home Valuation Report is an in-depth analysis detailing your home's value as well as a comparison with similar homes in the area
Home Values in the Area
Average Home Value in this Area
Purchase History
| Date | Buyer | Sale Price | Title Company |
|---|---|---|---|
| Welter Volker W M | -- | None Available | |
| Welter Volker Werner Maria | $329,000 | Stewart Title Of Ca 15 | |
| Mitchell Leroy C | -- | None Available |
Source: Public Records
Mortgage History
| Date | Status | Borrower | Loan Amount |
|---|---|---|---|
| Open | Welter Volker Werner Maria | $269,000 |
Source: Public Records
Tax History
| Year | Tax Paid | Tax Assessment Tax Assessment Total Assessment is a certain percentage of the fair market value that is determined by local assessors to be the total taxable value of land and additions on the property. | Land | Improvement |
|---|---|---|---|---|
| 2025 | $2,958 | $287,000 | $101,000 | $186,000 |
| 2023 | $2,958 | $248,000 | $87,000 | $161,000 |
| 2022 | $2,686 | $243,000 | $85,000 | $158,000 |
| 2021 | $2,305 | $203,000 | $71,000 | $132,000 |
| 2020 | $2,142 | $189,000 | $66,000 | $123,000 |
| 2019 | $2,148 | $189,000 | $66,000 | $123,000 |
| 2018 | $2,051 | $180,000 | $63,000 | $117,000 |
| 2017 | $1,948 | $171,000 | $60,000 | $111,000 |
| 2016 | $1,693 | $149,000 | $52,000 | $97,000 |
| 2014 | $1,477 | $129,000 | $45,000 | $84,000 |
Source: Public Records
Map
Nearby Homes
- 117 S I St
- 217 N M St
- 215 S H St
- 801, 851 California 246
- 510 N I St
- 526 N L St
- 205 S E St
- 425 S J St
- 533 N G St
- 1011 W Walnut Ave
- 531 N O St
- 113 N B St
- 23 Village Circle Dr
- 413 S O Place
- 267 Village Circle Dr
- 319 S B St
- 1410 W Apricot Ave
- 1311 W Cypress Ave Unit B2
- 616 University Dr
- 1408 W Walnut Ave
Your Personal Tour Guide
Ask me questions while you tour the home.