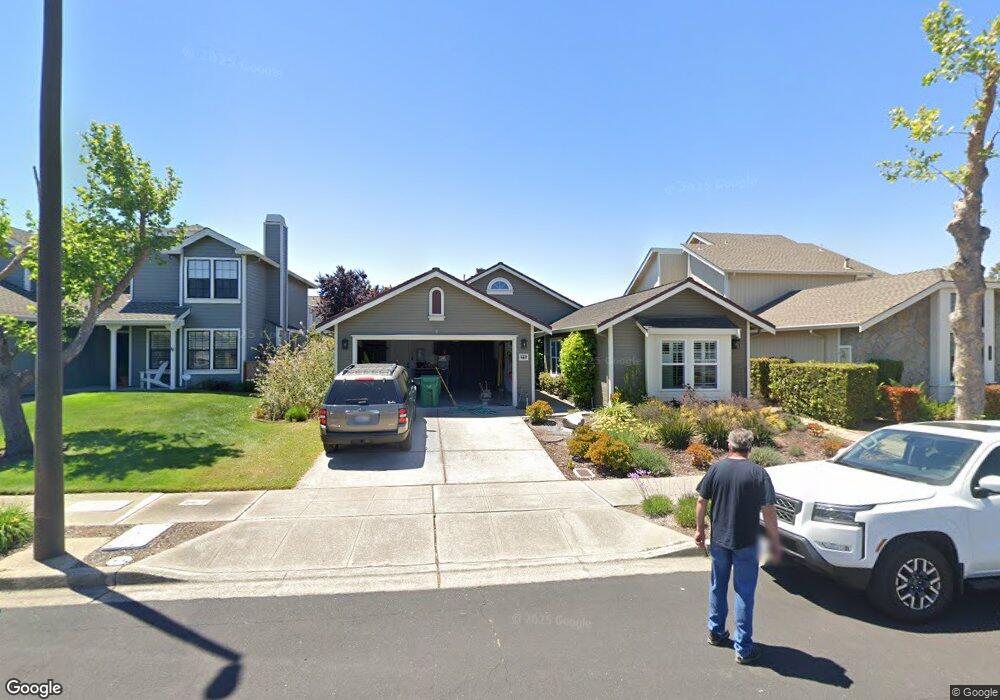
129 Nottingham Dr Alameda, CA 94502
Harbor Bay/Bay Farm NeighborhoodEstimated Value: $1,305,000 - $1,545,000
3
Beds
2
Baths
1,809
Sq Ft
$787/Sq Ft
Est. Value
About This Home
This home is located at 129 Nottingham Dr, Alameda, CA 94502 and is currently estimated at $1,423,613, approximately $786 per square foot. 129 Nottingham Dr is a home located in Alameda County with nearby schools including Bay Farm School, Lincoln Middle School, and Alameda High School.
Ownership History
Date
Name
Owned For
Owner Type
Purchase Details
Closed on
Dec 15, 2007
Sold by
Stoia Gregory M and Stoia Deanna R
Bought by
Stoia Gregory M and Stoia Deanna R
Current Estimated Value
Purchase Details
Closed on
Jul 7, 1998
Sold by
Kerr Marlene
Bought by
Stoia Gregory M and Stoia Deanna R
Home Financials for this Owner
Home Financials are based on the most recent Mortgage that was taken out on this home.
Original Mortgage
$175,000
Outstanding Balance
$35,906
Interest Rate
7.03%
Estimated Equity
$1,387,707
Purchase Details
Closed on
Nov 7, 1996
Sold by
Wong Deanna
Bought by
Kerr Marlene
Home Financials for this Owner
Home Financials are based on the most recent Mortgage that was taken out on this home.
Original Mortgage
$207,000
Interest Rate
7.75%
Purchase Details
Closed on
Apr 7, 1995
Sold by
Kwong Shek Kwun
Bought by
Wong Deanna
Create a Home Valuation Report for This Property
The Home Valuation Report is an in-depth analysis detailing your home's value as well as a comparison with similar homes in the area
Home Values in the Area
Average Home Value in this Area
Purchase History
| Date | Buyer | Sale Price | Title Company |
|---|---|---|---|
| Stoia Gregory M | -- | None Available | |
| Stoia Gregory M | -- | None Available | |
| Stoia Gregory M | $359,000 | Placer Title Company | |
| Kerr Marlene | $275,000 | First American Title Guarant | |
| Wong Deanna | -- | First American Title Guarant | |
| Wong Deanna | -- | -- |
Source: Public Records
Mortgage History
| Date | Status | Borrower | Loan Amount |
|---|---|---|---|
| Open | Stoia Gregory M | $175,000 | |
| Previous Owner | Kerr Marlene | $207,000 |
Source: Public Records
Tax History Compared to Growth
Tax History
| Year | Tax Paid | Tax Assessment Tax Assessment Total Assessment is a certain percentage of the fair market value that is determined by local assessors to be the total taxable value of land and additions on the property. | Land | Improvement |
|---|---|---|---|---|
| 2025 | $9,010 | $562,774 | $168,832 | $393,942 |
| 2024 | $9,010 | $551,743 | $165,523 | $386,220 |
| 2023 | $8,684 | $540,926 | $162,278 | $378,648 |
| 2022 | $8,495 | $530,321 | $159,096 | $371,225 |
| 2021 | $8,298 | $519,924 | $155,977 | $363,947 |
| 2020 | $8,200 | $514,593 | $154,378 | $360,215 |
| 2019 | $7,610 | $504,505 | $151,351 | $353,154 |
| 2018 | $7,425 | $494,615 | $148,384 | $346,231 |
| 2017 | $7,101 | $484,918 | $145,475 | $339,443 |
| 2016 | $7,102 | $475,412 | $142,623 | $332,789 |
| 2015 | $7,076 | $468,271 | $140,481 | $327,790 |
| 2014 | $6,722 | $459,098 | $137,729 | $321,369 |
Source: Public Records
Map
Nearby Homes
- 2766 Sea View Pkwy
- 147 Cumberland Way
- 2959 Sea View Pkwy
- 158 Oak Park Dr
- 137 Parfait Ln
- 1839 Kofman Pkwy
- 137 Jervis Bay
- 3012 Bayview Dr
- 101 Carob Ln
- 109 Holly Oak Ln
- 3171 Bayview Dr
- 510 Lagunaria Ln
- 2829 Otis Dr
- 641 Centre Ct
- 642 Centre Ct
- 35 Leonard Ct
- 2431 Roosevelt Dr
- 975 Pearl St
- 3027 Alta Vista
- 1024 Regent St
- 135 Nottingham Dr
- 123 Nottingham Dr
- 18 Cheshire Ct
- 24 Cheshire Ct
- 117 Nottingham Dr
- 12 Cheshire Ct
- 241 Sherwood Ln
- 235 Sherwood Ln
- 28 Cheshire Ct
- 229 Sherwood Ln
- 128 Nottingham Dr
- 111 Nottingham Dr
- 122 Nottingham Dr
- 140 Nottingham Dr
- 223 Sherwood Ln
- 32 Cheshire Ct
- 116 Nottingham Dr
- 146 Nottingham Dr
- 105 Nottingham Dr
- 116 Brunswick Rd