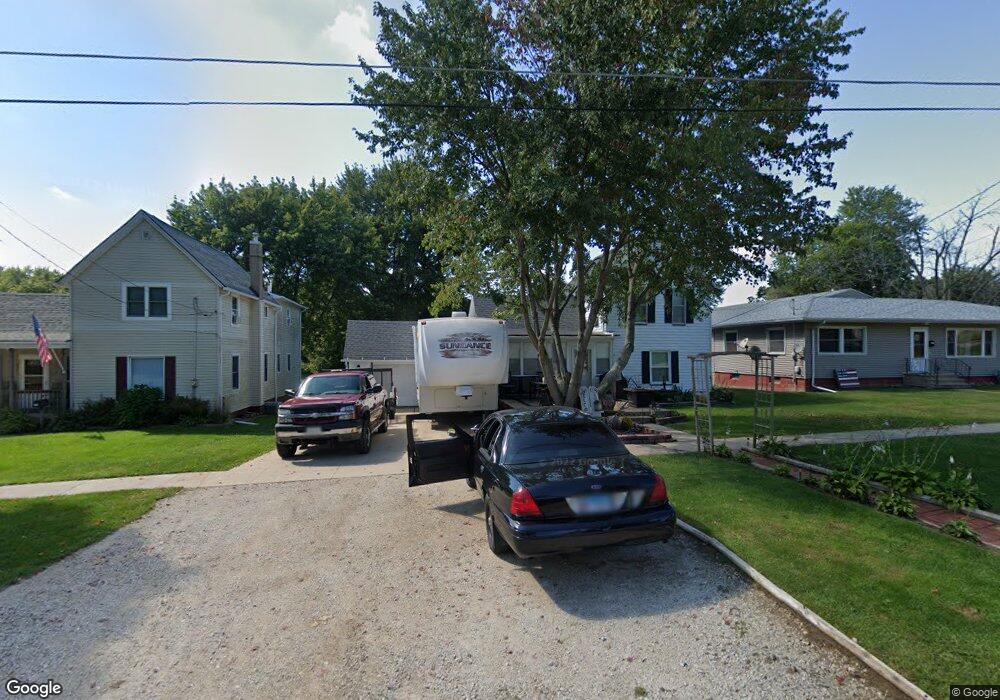
129 Payson St Kewanee, IL 61443
Estimated Value: $67,555 - $87,000
2
Beds
--
Bath
706
Sq Ft
$109/Sq Ft
Est. Value
About This Home
This home is located at 129 Payson St, Kewanee, IL 61443 and is currently estimated at $76,889, approximately $108 per square foot. 129 Payson St is a home located in Henry County with nearby schools including Wethersfield Elementary School, Wethersfield Junior/Senior High School, and Visitation Catholic School.
Create a Home Valuation Report for This Property
The Home Valuation Report is an in-depth analysis detailing your home's value as well as a comparison with similar homes in the area
Home Values in the Area
Average Home Value in this Area
Tax History
| Year | Tax Paid | Tax Assessment Tax Assessment Total Assessment is a certain percentage of the fair market value that is determined by local assessors to be the total taxable value of land and additions on the property. | Land | Improvement |
|---|---|---|---|---|
| 2024 | $1,503 | $19,759 | $2,007 | $17,752 |
| 2023 | $1,362 | $18,127 | $1,841 | $16,286 |
| 2022 | $1,306 | $17,497 | $1,777 | $15,720 |
| 2021 | $1,303 | $17,071 | $1,734 | $15,337 |
| 2020 | $1,259 | $16,696 | $1,696 | $15,000 |
| 2019 | $1,230 | $16,704 | $1,697 | $15,007 |
| 2018 | $1,193 | $16,344 | $1,660 | $14,684 |
| 2017 | $361 | $16,135 | $1,639 | $14,496 |
| 2016 | $1,116 | $15,695 | $1,594 | $14,101 |
| 2015 | $1,014 | $15,164 | $1,540 | $13,624 |
| 2013 | $1,014 | $14,865 | $1,510 | $13,355 |
Source: Public Records
Map
Nearby Homes
- 136 W Mill St
- 702 Elliott St Unit 1
- 436 Hollis St
- 215 W Prospect St
- 732 S Main St
- 116 W Garfield St
- 512 Commercial St
- 328 E Prospect St
- 716 W 3rd St
- 712 Roosevelt Ave
- 202 Regina Ct
- 422 Ross St
- 0 N Main St Unit E 2nd
- 522 E 5th St
- 701 E 9th St
- 1221 June St
- 2283 E 2750th St
- 24508 County Highway 28
- 806 NE 3rd St
- 417 NE 2nd St
Your Personal Tour Guide
Ask me questions while you tour the home.