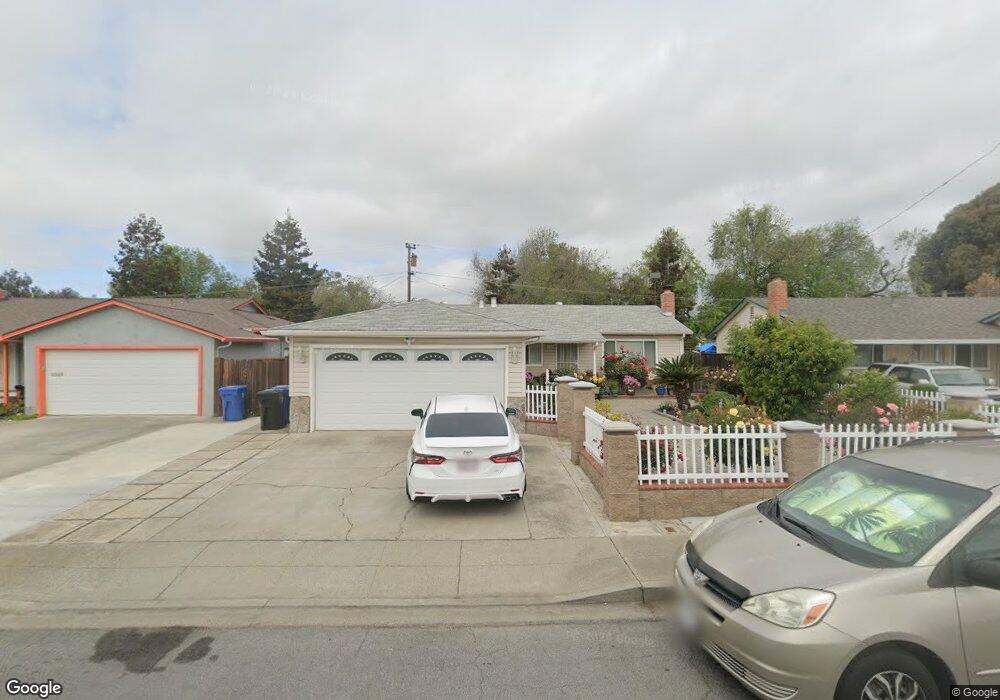
129 Peony Ct Fremont, CA 94538
Blacow NeighborhoodEstimated Value: $1,379,000 - $1,629,000
4
Beds
2
Baths
1,302
Sq Ft
$1,126/Sq Ft
Est. Value
About This Home
This home is located at 129 Peony Ct, Fremont, CA 94538 and is currently estimated at $1,466,694, approximately $1,126 per square foot. 129 Peony Ct is a home located in Alameda County with nearby schools including Steven Millard Elementary, G.M. Walters Middle School, and John F. Kennedy High School.
Ownership History
Date
Name
Owned For
Owner Type
Purchase Details
Closed on
May 28, 2002
Sold by
Eaker Michael L and Eaker Melissa
Bought by
Lam Hoan H and Ho Camha T
Current Estimated Value
Home Financials for this Owner
Home Financials are based on the most recent Mortgage that was taken out on this home.
Original Mortgage
$358,400
Outstanding Balance
$151,754
Interest Rate
6.83%
Estimated Equity
$1,314,940
Purchase Details
Closed on
Mar 20, 2001
Sold by
Eaker Dallas R and Eaker Norma
Bought by
Eaker Michael L
Purchase Details
Closed on
Apr 12, 2000
Sold by
Eaker Dallas R
Bought by
Eaker Dallas R and Eaker Michael L
Home Financials for this Owner
Home Financials are based on the most recent Mortgage that was taken out on this home.
Original Mortgage
$175,000
Interest Rate
8.25%
Purchase Details
Closed on
Feb 21, 1996
Sold by
Eaker Dallas R and Eaker Anna M
Bought by
Eaker Dallas R and Eaker Anna M
Create a Home Valuation Report for This Property
The Home Valuation Report is an in-depth analysis detailing your home's value as well as a comparison with similar homes in the area
Home Values in the Area
Average Home Value in this Area
Purchase History
| Date | Buyer | Sale Price | Title Company |
|---|---|---|---|
| Lam Hoan H | $448,000 | Fidelity National Title Co | |
| Eaker Michael L | -- | Fidelity National Title Co | |
| Eaker Michael L | -- | -- | |
| Eaker Dallas R | -- | Chicago Title Co | |
| Eaker Dallas R | -- | -- |
Source: Public Records
Mortgage History
| Date | Status | Borrower | Loan Amount |
|---|---|---|---|
| Open | Lam Hoan H | $358,400 | |
| Previous Owner | Eaker Dallas R | $175,000 |
Source: Public Records
Tax History Compared to Growth
Tax History
| Year | Tax Paid | Tax Assessment Tax Assessment Total Assessment is a certain percentage of the fair market value that is determined by local assessors to be the total taxable value of land and additions on the property. | Land | Improvement |
|---|---|---|---|---|
| 2025 | $8,097 | $654,784 | $198,535 | $463,249 |
| 2024 | $8,097 | $641,811 | $194,643 | $454,168 |
| 2023 | $7,874 | $636,091 | $190,827 | $445,264 |
| 2022 | $7,765 | $616,620 | $187,086 | $436,534 |
| 2021 | $7,575 | $604,394 | $183,418 | $427,976 |
| 2020 | $7,573 | $605,126 | $181,538 | $423,588 |
| 2019 | $7,487 | $593,263 | $177,979 | $415,284 |
| 2018 | $7,339 | $581,633 | $174,490 | $407,143 |
| 2017 | $7,155 | $570,231 | $171,069 | $399,162 |
| 2016 | $7,029 | $559,054 | $167,716 | $391,338 |
| 2015 | $6,932 | $550,658 | $165,197 | $385,461 |
| 2014 | $6,810 | $539,875 | $161,962 | $377,913 |
Source: Public Records
Map
Nearby Homes
- 40422 Landon Ave
- 5341 Audubon Park Ct
- 5580 Hemlock Terrace
- 4840 Piper St
- 39997 Cedar Blvd Unit 153
- 4751 Wadsworth Ct
- 4860 Bryce Canyon Park Dr
- 39975 Cedar Blvd Unit 136
- 39857 Pelton Terrace
- 39887 Cedar Blvd Unit 253
- 39965 Potrero Dr
- 5589 Roosevelt Place
- 39850 Sundale Dr
- 40696 Robin St
- 4537 Capewood Terrace
- 39965 Parada St Unit A
- 4533 Capewood Terrace
- 6452 Buena Vista Dr
- 4737 Boone Dr
- 6204 Buena Vista Dr Unit B