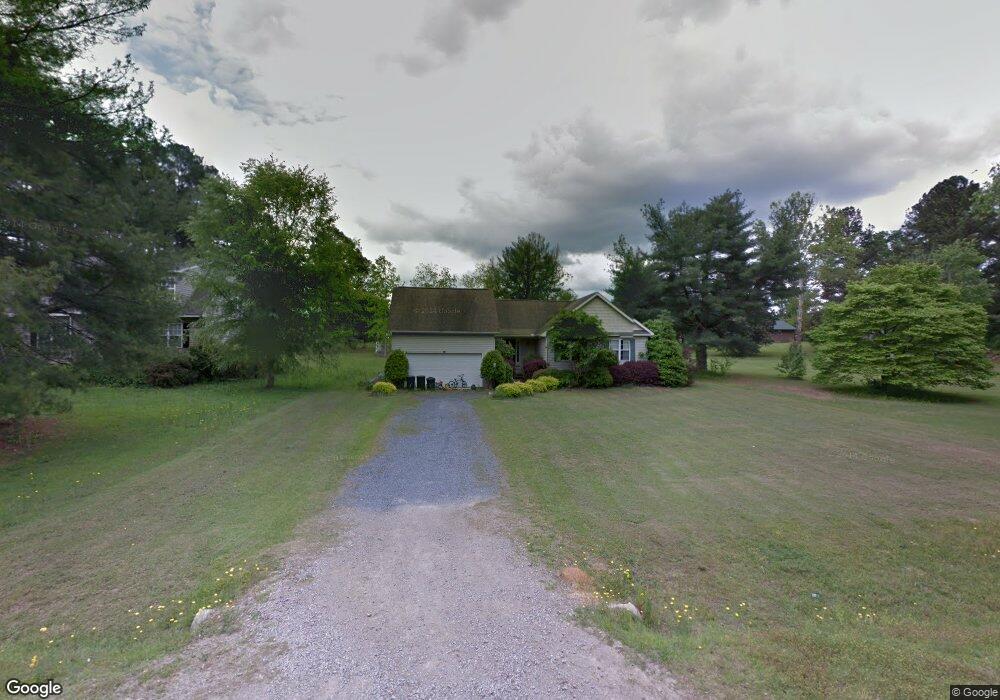
129 Rebel Rd Carthage, NC 28327
Estimated Value: $323,000 - $378,000
3
Beds
2
Baths
1,670
Sq Ft
$208/Sq Ft
Est. Value
About This Home
This home is located at 129 Rebel Rd, Carthage, NC 28327 and is currently estimated at $347,383, approximately $208 per square foot. 129 Rebel Rd is a home located in Moore County with nearby schools including Sandhills Farm Life Elementary School, New Century Middle School, and Union Pines High School.
Ownership History
Date
Name
Owned For
Owner Type
Purchase Details
Closed on
Nov 16, 2009
Sold by
Wood Martin Norman and Wood Debora Gay
Bought by
Garner Timothy R
Current Estimated Value
Home Financials for this Owner
Home Financials are based on the most recent Mortgage that was taken out on this home.
Original Mortgage
$145,000
Outstanding Balance
$91,959
Interest Rate
4.92%
Mortgage Type
New Conventional
Estimated Equity
$255,424
Purchase Details
Closed on
Jun 20, 2000
Sold by
Wood Marty N and Wood Debora G
Bought by
Garner Timothy R
Create a Home Valuation Report for This Property
The Home Valuation Report is an in-depth analysis detailing your home's value as well as a comparison with similar homes in the area
Home Values in the Area
Average Home Value in this Area
Purchase History
| Date | Buyer | Sale Price | Title Company |
|---|---|---|---|
| Garner Timothy R | $185,000 | None Available | |
| Garner Timothy R | $140,000 | -- |
Source: Public Records
Mortgage History
| Date | Status | Borrower | Loan Amount |
|---|---|---|---|
| Open | Garner Timothy R | $145,000 |
Source: Public Records
Tax History
| Year | Tax Paid | Tax Assessment Tax Assessment Total Assessment is a certain percentage of the fair market value that is determined by local assessors to be the total taxable value of land and additions on the property. | Land | Improvement |
|---|---|---|---|---|
| 2025 | $1,002 | $238,540 | $50,000 | $188,540 |
| 2024 | $1,038 | $238,540 | $50,000 | $188,540 |
| 2023 | $1,085 | $238,540 | $50,000 | $188,540 |
| 2022 | $1,062 | $168,610 | $35,000 | $133,610 |
| 2021 | $1,104 | $168,610 | $35,000 | $133,610 |
| 2020 | $1,088 | $168,610 | $35,000 | $133,610 |
| 2019 | $1,088 | $168,610 | $35,000 | $133,610 |
| 2018 | $936 | $156,000 | $30,000 | $126,000 |
| 2017 | $913 | $156,000 | $30,000 | $126,000 |
| 2015 | $881 | $156,000 | $30,000 | $126,000 |
| 2014 | $839 | $154,440 | $23,250 | $131,190 |
| 2013 | -- | $154,440 | $23,250 | $131,190 |
Source: Public Records
Map
Nearby Homes
- 255 Foxcroft Rd
- 370 Michael Rd
- 171 Pine Ridge Dr
- 13 Buckley Ct
- 9 Banning Dr
- 125 Dublin Ct
- 2 Kenilwood Ct
- 4 Kenilwood Ct
- 1 Kenilwood Ct
- 33 Banning Dr
- 32 Elkton Dr
- 1336 McCaskill Rd
- 12 Hemlock Ct
- 41 Middlebury Rd
- 4 Woodward Place
- 1 Woodward Place
- 409 Meyer Farm Dr
- 11 Elkton Dr
- 32 Bogie Dr
- 1 Kenwood Ct
Your Personal Tour Guide
Ask me questions while you tour the home.