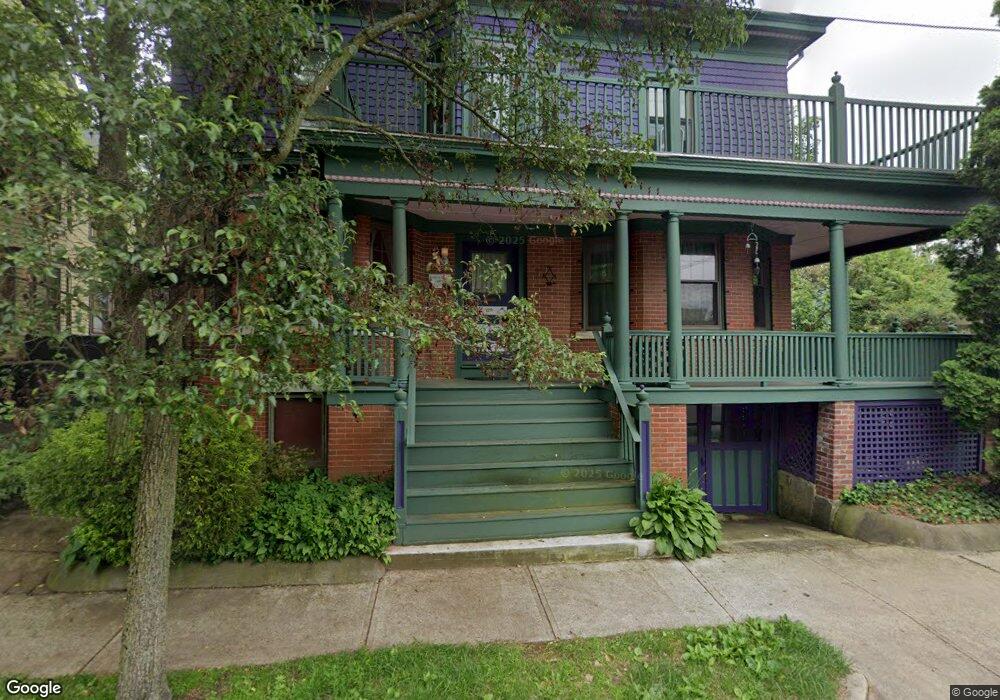
129 Rochambeau Ave Providence, RI 02906
Mount Hope NeighborhoodEstimated Value: $695,000 - $1,033,000
5
Beds
3
Baths
3,000
Sq Ft
$305/Sq Ft
Est. Value
About This Home
This home is located at 129 Rochambeau Ave, Providence, RI 02906 and is currently estimated at $916,077, approximately $305 per square foot. 129 Rochambeau Ave is a home located in Providence County with nearby schools including Jewish Community Day School Of Rhode Island, Moses Brown School, and Montessori Childrens House.
Ownership History
Date
Name
Owned For
Owner Type
Purchase Details
Closed on
Mar 9, 2016
Sold by
Francis Christine A
Bought by
Ortiz David and Lombardi Carmel
Current Estimated Value
Home Financials for this Owner
Home Financials are based on the most recent Mortgage that was taken out on this home.
Original Mortgage
$335,805
Outstanding Balance
$264,241
Interest Rate
3.64%
Estimated Equity
$651,836
Purchase Details
Closed on
Jul 7, 2006
Sold by
Diamantides Jerry and Hayes Eileen M
Bought by
Francis Christine A and Barta William P
Purchase Details
Closed on
Mar 31, 1997
Sold by
Wooler Robert W and Wooler Kathleen
Bought by
Diamantides Jery and Hayes Eileen
Purchase Details
Closed on
Jun 2, 1993
Sold by
Stone Brian J and Stone Andree
Bought by
Wooler Robert F and Wooler Kathleen
Purchase Details
Closed on
Jul 8, 1991
Sold by
Liu Hsiang Mei
Bought by
Stone Biran J
Create a Home Valuation Report for This Property
The Home Valuation Report is an in-depth analysis detailing your home's value as well as a comparison with similar homes in the area
Home Values in the Area
Average Home Value in this Area
Purchase History
| Date | Buyer | Sale Price | Title Company |
|---|---|---|---|
| Ortiz David | -- | -- | |
| Francis Christine A | $375,000 | -- | |
| Diamantides Jery | $133,000 | -- | |
| Wooler Robert F | $147,500 | -- | |
| Stone Biran J | $120,000 | -- |
Source: Public Records
Mortgage History
| Date | Status | Borrower | Loan Amount |
|---|---|---|---|
| Open | Stone Biran J | $335,805 | |
| Closed | Stone Biran J | -- |
Source: Public Records
Tax History
| Year | Tax Paid | Tax Assessment Tax Assessment Total Assessment is a certain percentage of the fair market value that is determined by local assessors to be the total taxable value of land and additions on the property. | Land | Improvement |
|---|---|---|---|---|
| 2025 | $6,798 | $809,300 | $395,100 | $414,200 |
| 2024 | $12,917 | $703,900 | $304,200 | $399,700 |
| 2023 | $12,917 | $703,900 | $304,200 | $399,700 |
| 2022 | $12,529 | $703,900 | $304,200 | $399,700 |
| 2021 | $10,696 | $435,500 | $192,500 | $243,000 |
| 2020 | $10,239 | $416,900 | $192,500 | $224,400 |
| 2019 | $10,239 | $416,900 | $192,500 | $224,400 |
| 2018 | $13,529 | $423,300 | $191,400 | $231,900 |
| 2017 | $13,529 | $423,300 | $191,400 | $231,900 |
| 2016 | $13,529 | $423,300 | $191,400 | $231,900 |
| 2015 | $12,389 | $374,300 | $177,800 | $196,500 |
| 2014 | $12,633 | $374,300 | $177,800 | $196,500 |
| 2013 | $12,633 | $374,300 | $177,800 | $196,500 |
Source: Public Records
Map
Nearby Homes
- 104 Woodbine St
- 169 Ivy St Unit 2
- 214 Camp St
- 21 Dexterdale Rd
- 89 Dexterdale Rd
- 101 Grand View St Unit 1
- 152 Colonial Rd Unit 152
- 20 Peach Ave
- 94 Larch St
- 71 Savoy St
- 135 Cypress St
- 153 4th St
- 56 Ivy St
- 12 Holly St
- 236 Pleasant St
- 41 Stadium Rd
- 114 Jenkins St
- 269 Doyle Ave
- 218 Howell St Unit 2
- 296 Cole Ave
- 131 Rochambeau Ave
- 7 Dana St
- 135 Rochambeau Ave
- 130 Lancaster St
- 126 Lancaster St
- 124 Rochambeau Ave
- 120 Lancaster St
- 138 Lancaster St Unit 2
- 138 Lancaster St Unit A
- 138 Lancaster St
- 138 Lancaster St Unit 1
- 32 Dana St
- 136 Lancaster St Unit 1
- 136 Lancaster St Unit B
- 136 Lancaster St Unit A
- 136 Lancaster St Unit 2
- 136 Lancaster St Unit lancaster
- 136 Lancaster St
- 136 Rochambeau Ave
- 116 Lancaster St
Your Personal Tour Guide
Ask me questions while you tour the home.