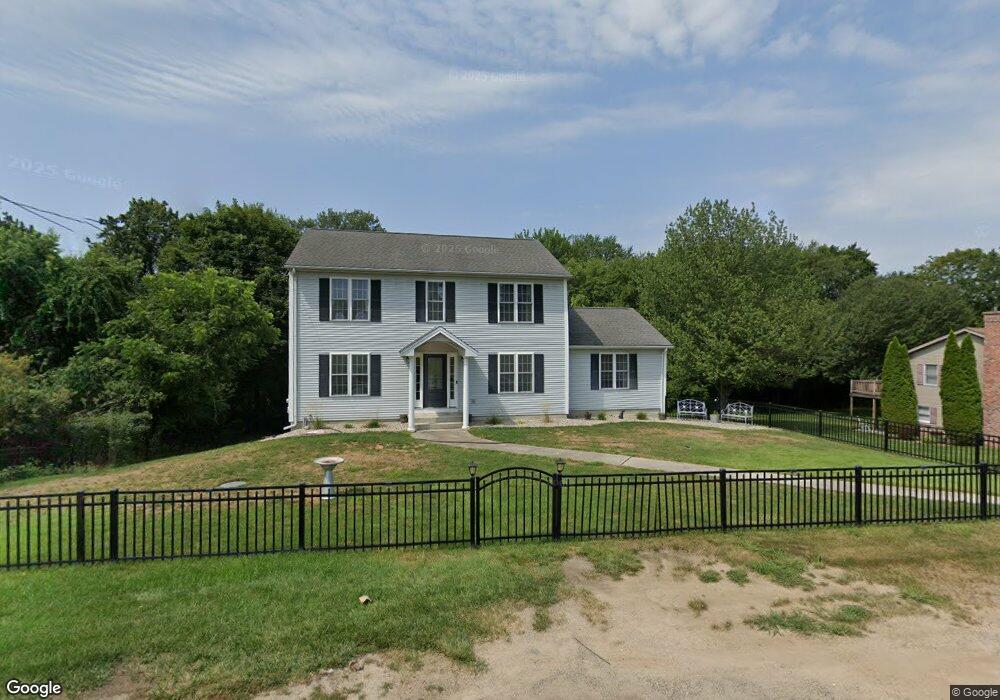
129 Rood St Ludlow, MA 01056
Estimated Value: $517,043 - $671,000
3
Beds
3
Baths
2,256
Sq Ft
$252/Sq Ft
Est. Value
About This Home
This home is located at 129 Rood St, Ludlow, MA 01056 and is currently estimated at $567,511, approximately $251 per square foot. 129 Rood St is a home located in Hampden County with nearby schools including East Street Elementary School, Chapin Street Elementary School, and Paul R. Baird Middle School.
Ownership History
Date
Name
Owned For
Owner Type
Purchase Details
Closed on
Jul 15, 2004
Sold by
Kuselias Jeffrey
Bought by
Gilrein Christina F and Gilrein Michael J
Current Estimated Value
Home Financials for this Owner
Home Financials are based on the most recent Mortgage that was taken out on this home.
Original Mortgage
$230,000
Outstanding Balance
$115,130
Interest Rate
6.25%
Mortgage Type
Purchase Money Mortgage
Estimated Equity
$452,381
Purchase Details
Closed on
Mar 11, 2003
Sold by
Jolicoeur Albert A and Jolicoeur James A
Bought by
Kuselias Jeffrey
Create a Home Valuation Report for This Property
The Home Valuation Report is an in-depth analysis detailing your home's value as well as a comparison with similar homes in the area
Home Values in the Area
Average Home Value in this Area
Purchase History
| Date | Buyer | Sale Price | Title Company |
|---|---|---|---|
| Gilrein Christina F | $315,000 | -- | |
| Kuselias Jeffrey | $25,000 | -- |
Source: Public Records
Mortgage History
| Date | Status | Borrower | Loan Amount |
|---|---|---|---|
| Open | Gilrein Christina F | $230,000 |
Source: Public Records
Tax History
| Year | Tax Paid | Tax Assessment Tax Assessment Total Assessment is a certain percentage of the fair market value that is determined by local assessors to be the total taxable value of land and additions on the property. | Land | Improvement |
|---|---|---|---|---|
| 2025 | $7,648 | $440,800 | $107,600 | $333,200 |
| 2024 | $7,326 | $405,000 | $107,600 | $297,400 |
| 2023 | $7,186 | $368,300 | $94,400 | $273,900 |
| 2022 | $6,773 | $338,800 | $94,400 | $244,400 |
| 2021 | $6,805 | $322,800 | $94,400 | $228,400 |
| 2020 | $6,516 | $316,000 | $93,000 | $223,000 |
| 2019 | $6,198 | $312,700 | $92,100 | $220,600 |
| 2018 | $5,830 | $306,700 | $92,100 | $214,600 |
| 2017 | $5,659 | $305,400 | $90,300 | $215,100 |
| 2016 | $5,613 | $309,600 | $88,500 | $221,100 |
| 2015 | $5,305 | $306,800 | $87,600 | $219,200 |
Source: Public Records
Map
Nearby Homes
- '0' Rood St
- 665 Center St Unit 706
- 25 Fox Hill Rd
- 676 Chapin St
- 70 Sroka Ln
- 84 Chapin Greene Dr
- 102 Swan Ave
- 173 Colonial Dr
- 5052 Booth St
- 47 Kendall St
- 382 Holyoke St
- 98 Fuller St Unit 32
- 37 Waters Edge Unit 37
- 420 West St
- 70 Fuller St
- 482 Holyoke St
- 350 West St Unit 3
- 350 West St Unit 19
- 259 Prospect St
- 0 Fuller St Unit 73409741
Your Personal Tour Guide
Ask me questions while you tour the home.